
| Animations courtesy of Dan Russell, Grad. Prog. Acoustics, Penn State. | ||
| Copyright© by Barry Truax (Handbook for Acoustic Ecology). | ||
What is common to all sound is a pattern of change over time called "oscillation" or "vibration". It need not be necessarily regular or repetitive, but there must be a series of oscillating changes that allow energy to travel or change media, whether it is a sound wave or a sound signal. The description, measurement, and subjective response to this aspect of sound under more or less ideal conditions is probably the most complex of the entire field.
The basic nature of sound derives from the physical behaviour called "oscillation", a phenomenon common to many physical systems. Oscillation in a medium gives rise to the propagation of a "wave", the series of oscillations that carry energy and, from the listener's perspective, potential information. Among the basic parameters which commonly describe oscillation and waves, the most commonly used is the concept of "frequency".
Vibration, oscillation, wave and periodic motion are all related terms.
We say that something is periodic when has a characteristic ascribed to a variable which repeats any value it attains at regular intervals of time.
Oscillation. Any quantity is in a state of oscillation when its value is continually changing so that it passes through maximum and minimum values. Oscillations can be periodic or random.
An oscillation that passes repeatedly through maximum and minimum values at the same rate, or regular interval of time called period, is said to be periodic (or regular). An oscillation is said to be random when its instantaneous magnitude is not specified for any given instant of time, but rather is described in terms of probability distribution functions.
An oscillation is said to be forced when it is in response to an excitation; otherwise it is called free.
When such oscillation is in a variable that represents the motion, we speak of oscillating motion.
When the oscillating quantity is the position of a body, we speak of such oscillating motion as the vibration of the body. A vibration is an oscillatory motion of the position of any mechanical system. Vibrations are a subset of oscillations. The natural modes of vibration of an object are its resonant frequencies.
A cycle is a complete turn of events of a periodic quantity. Is the part of the oscillation that repeats itself.
When an object vibrates, one cycle is the movement from its initial position to a point of maximum displacement in one direction, followed by movement to a point of maximum displacement in the opposite direction and a return to its initial position.
By analogy to one turn, one cycle is divided in 360 degrees or 2π radians.
1 cycle = 360 deg = 2π rad
The phase is the parameter that indicates the reached stage within the cycle. The phase of a cycle ranges from 0 degrees ( 0 radians) to 360 degrees (2π radians). Two vibrating particles are said to be in phase when they are at the same stage in the cycle at the same time, and out of phase when they are at opposite stages.
The time taken by one complete cycle is called a period. Period is denoted by the symbol T, and is measured in seconds (s).
The frequency is the rate of repetition of the cycles of a periodic quantity. More generally, frequency can be thought of as the rate of change of phase. Frequency is denoted by the symbol f, and is measured in hertz (Hz), formerly called cycles per second (cps or c/s).
Thus, frequency is the inverse of the period.
T = 1 / f
For example, if f = 440 Hz, then T = 1/440 s. = 2.27 ms.
Harmonic = sinusoidal
The Simple Harmonic Motion (SHM) is periodic oscillating movement of a particle or body in which the displacement (deviation of its resting position) in the time can be described by a sine function.
A swinging pendulum, a vibrating string, or a bobbing buoy are all examples of Simple Harmonic Motion.
We find this type of movement, for instance of a particle in a solid, fluid or gas, when there is a 'restoring' force, which tries to take the particle to its resting position (or random motion), and the value of that force is proportional to the displacement of the particle (Hooke's law).
This motion describes a sine wave from the trace of a pen attached to the particle and moving against paper travelling at uniform speed.
Similarly, simple harmonic motion may be derived from the projection (OC) onto the axis of a circle of a point (p) moving with constant speed on the circumference. The angular velocity w of the motion is defined in radians per second as the angle q moved through per unit time.
w = q/t

The time that the point takes to make a turn is the period (T = 1/f) and so,
w = 2pf
The displacement d (length of the segment OC), whose maximum is the amplitude A, may be expressed as:
d = A sin q = A sin wt = A sin (2pft)
In physics we can define a wave as a disturbance or variation which travels through a medium (or through the space and time), accompanied by a transfer of energy. The medium through which the wave travels may experience some local oscillations as the wave passes, but the particles in the medium do not travel with the wave, that is with no permanent displacement. The disturbance may take any of a number of shapes, from a finite width pulse to an infinitely long sine wave.
The tricky part of understanding wave motion is recognizing the differences between the time and space behavior.

There are two main types of waves: mechanical and electromagnetic. Further, the behaviour of particles in quantum mechanics is described by waves and some theories predict the existence of gravitational waves travelling through space, although as up today have never been detected.
Mechanical waves need a material medium to propagate through, and the substance of this medium is deformed. The deformation reverses itself owing to restoring forces resulting from its deformation. There are three types of mechanical waves: transverse waves, longitudinal waves, and surface waves.
Amplitudes of the mechanical waves have to be smaller enough than the wavelength. When amplitude gets comparable to the wavelength, significant nonlinear effects (such as harmonic generation) may occur, and, if large enough, may result in chaotic effects (for example, waves on the surface of the sea water break, resulting in a foam on the surface and turbulent mixing).
In contrast, electromagnetic waves require no medium, but can still travel through one. They consist of periodic oscillations of electrical and magnetic fields generated by distant charged particles.
Being a wave something that travels in a medium, the next question is how quickly it is, and how the medium properties and the wave properties affect it.
For the mechanical waves the medium could be water, air, a string, a spring, etc. These media are distinguished by their properties: the material they are made of, its shape and the physical properties of that material such as the density, the temperature, the elasticity, etc. Such physical properties describe the medium itself, not the wave.
On the other hand, waves are distinguished from each other by their properties: amplitude, wavelength, frequency, etc. These properties describe the wave, not the medium through which the wave is moving.
From the experimental results we know that the speed of a wave is not dependent upon (causally affected by) properties of the wave itself. Rather, the speed of the wave is dependent upon the properties of the medium through which the wave is moving. Only an alteration in the properties of the medium will cause a change in the speed.
In common everyday speech, speed of sound refers to the speed of sound waves in air. However, the speed of sound varies from substance to substance. Sound travels faster in liquids and non-porous solids than it does in air. Sound waves in solids are composed of compression waves (just as in gases and liquids), but also exhibit a different type of sound wave called a shear wave, which occurs only in solids. These different types of waves in solids usually travel at different speeds, as exhibited in seismology.
The transmission of longitudinal sound can be illustrated by using a model consisting of an array of balls interconnected by springs. Sound passes through the model by compressing and expanding the springs, transmitting energy to neighbouring balls, which transmit energy to their springs, and so on. The speed of sound through the model depends on the stiffness of the springs (stiffer springs transmit energy more quickly) and on the mass of the balls (heavier masses transmit energy more slowly). The stiffness is the resistance of an elastic body to deformation by an applied force.
For real material the balls represent molecules and the springs represent the bonds between them. The stiffness of the springs is called the elastic modulus, and the mass corresponds to the density.
All other things being equal, sound will travel faster in stiffer materials. Longitudinal waves or "compression-type" sound will travel faster in solids than in liquids, and faster in liquids than in gases, because the solids are more difficult to compress than liquids, while liquids in turn are more difficult to compress than gases.
Similarly, sound travels faster in lighter materials and more slowly as the density increases. Some textbooks mistakenly state that the speed of sound increases with increasing density. This is usually illustrated by presenting data for three materials, such as air, water and steel, which also have vastly different compressibilities which more than make up for the density differences.
An illustrative example of the two effects (compressibility and density) is that sound travels only 4.3 times faster in water than air, despite enormous differences in compressibility of the two media. The reason is that the larger density of water, which works to slow sound in water relative to air, nearly compensates for the compressibility differences in the two media.
In general, the speed of sound c is given by the Newton-Laplace equation:

where
K is a coefficient of
stiffness, the bulk
modulus (or the modulus of bulk elasticity for gases),
 is the density
Thus the speed of sound increases with the stiffness (the resistance of an elastic body to deformation by an applied force) of the material, and decreases with the density. For ideal gases the bulk modulus P is simply the gas pressure multiplied by the adiabatic index.
For general equations of state, if classical mechanics is used, the speed of
sound  is given by

where
 is the pressure,
is the density
and
the derivative is taken with respect
to
adiabatic change.
The speed of sound for a given ideal gas is independent of the wave frequency (an ideal gas is a non-dispersive medium), so the speeds of energy transport and sound propagation are the same.
It is also independent of pressure or density. Although the speed of sound ,in the case of gases only, may be expressed in terms of a ratio of both density and pressure, these quantities cancel in ideal gases at any given temperature, composition, and heat capacity. This leads to a velocity expression in ideal gases using only the latter independent variables.
The speed of sound is a function of the square root of the absolute temperature.
For a given ideal gas the sound speed depends only on its temperature. At a constant temperature, the ideal gas pressure has no effect on the speed of sound, because pressure and density (also proportional to pressure) have equal but opposite effects on the speed of sound, and the two contributions cancel out exactly.
In gases the density contributes to the compressibility in such a way that some part of each attribute factors out, leaving only a dependence on temperature, molecular weight, and heat capacity ratio. Thus, for a single given gas (where molecular weight does not change) and over a small temperature range (where heat capacity is relatively constant), the speed of sound becomes dependent on only the temperature of the gas.
For a gas, K (the bulk modulus, equivalent to the coefficient of stiffness, C, in solids) is approximately given by

thus

Where:
p is the pressure
is the
density
 is the
adiabatic index also known as the isentropic expansion factor. It is
the ratio of specific heats of a gas at a constant-pressure to a gas at a
constant-volume(
is the
adiabatic index also known as the isentropic expansion factor. It is
the ratio of specific heats of a gas at a constant-pressure to a gas at a
constant-volume( ),
and arises because a classical sound wave induces an adiabatic compression, in
which the heat of the compression does not have enough time to escape the
pressure pulse, and thus contributes to the pressure induced by the compression.
),
and arises because a classical sound wave induces an adiabatic compression, in
which the heat of the compression does not have enough time to escape the
pressure pulse, and thus contributes to the pressure induced by the compression.

n is the amount of
substance in moles
 is the gas constant
The heat capacity ratio (
) for an
ideal gas can be related to the
degrees of freedom (
 ) of a
molecule by:
) of a
molecule by:

Thus we observe that for a monatomic gas, with three degrees of freedom:
 ,
,while for a diatomic gas, with five degrees of freedom (at room temperature: three translational and two rotational degrees of freedom; the vibrational degree of freedom is not involved except at high temperatures):
 .
.E.g.: The terrestrial air is primarily made up of diatomic gases (~78% nitrogen (N2) and ~21% oxygen (O2)) and at standard conditions it can be considered to be an ideal gas. The above value of 1.4 is highly consistent with the measured adiabatic indices for bone-dry air within a temperature range of 0 to 200 °C, exhibiting a deviation of only 0.2 % (see tablation below).
|
Heat Capacity Ratio for various gases |
||||||||||||||||||||||||||||||||||||||||||||||||||||||||||||||||||||||||||||||||||||||||||||||||||||||||||||||||||||||||||||||||||||||||||||||||||||||||||||
|
|
|
|
|
||||||||||||||||||||||||||||||||||||||||||||||||||||||||||||||||||||||||||||||||||||||||||||||||||||||||||||||||||||||||||||||||||||||||||||||||||||||||
Using the
ideal gas law to replace
with nRT/V,
and replacing ρ with nM/V, the equation for an ideal gas
becomes:

where
 is the speed of sound in an ideal gas.
(approximately 8.3145 J·mol−1·K−1) is the
molar gas constant.
is the speed of sound in an ideal gas.
(approximately 8.3145 J·mol−1·K−1) is the
molar gas constant. is the
Boltzmann constant
(gamma) is the
adiabatic index (sometimes assumed 7/5 = 1.40 for diatomic molecules from
kinetic theory, assuming from quantum theory a temperature range at which
thermal energy is fully partitioned into rotation (rotations are fully
excited), but none into vibrational modes. Gamma is actually experimentally
measured over a range from 1.3991 to 1.403 at 0 degrees Celsius, for air.
Gamma is assumed from kinetic theory to be exactly 5/3 = 1.6667 for monoatomic
molecules such as noble gases).
is the
Boltzmann constant
(gamma) is the
adiabatic index (sometimes assumed 7/5 = 1.40 for diatomic molecules from
kinetic theory, assuming from quantum theory a temperature range at which
thermal energy is fully partitioned into rotation (rotations are fully
excited), but none into vibrational modes. Gamma is actually experimentally
measured over a range from 1.3991 to 1.403 at 0 degrees Celsius, for air.
Gamma is assumed from kinetic theory to be exactly 5/3 = 1.6667 for monoatomic
molecules such as noble gases). is the
absolute temperature in kelvin.
is the
absolute temperature in kelvin. is the molar
mass in
kilograms per mole.
The mean molar mass for dry air is about 0.0289645 kg/mol.
is the molar
mass in
kilograms per mole.
The mean molar mass for dry air is about 0.0289645 kg/mol. is the mass
of a single molecule in kilograms.
is the mass
of a single molecule in kilograms.This equation applies only when the sound wave is a small perturbation on the ambient condition, and the certain other noted conditions are fulfilled.
Newton famously considered the speed of sound before most of the development
of thermodynamics and so incorrectly used isothermal calculations instead of
adiabatic. His result was missing the factor of
but was
otherwise correct.
Numerical substitution of the above values gives the ideal gas approximation
of sound velocity for gases, which is accurate at relatively low gas pressures
and densities. Also, for diatomic gases the use of
= 1.4000
requires that the gas exist in a temperature range high enough that rotational
heat capacity is fully excited (i.e., molecular rotation is fully used as a heat
energy "partition" or reservoir); but at the same time the temperature must be
low enough that molecular vibrational modes contribute no heat capacity (i.e.,
insignificant heat goes into vibration, as all vibrational quantum modes above
the minimum-energy-mode, have energies too high to be populated by a significant
number of molecules at this temperature).
If temperatures in degrees Celsius (°C) are to be used, then Celsius
temperature
 may be used
For real gases, the situation is a little more complex.
For all real physical situations, the speed of the sound weakly depends on frequency. A mixture of oxygen and nitrogen constitutes a non-dispersive medium. But air does contain a small amount of CO2 which is a dispersive medium, and it introduces dispersion to air. For audible sounds is not very noticeable, but it has to be taken into account at ultrasonic frequencies (> 28 kHz). In a dispersive medium sound speed is a function of sound frequency, through the dispersion relation. The spatial and temporal distribution of a propagating disturbance will continually change. Each frequency component propagates at its own phase velocity, while the energy of the disturbance propagates at the group velocity.
In non-ideal gases, such as a van der Waals gas, the proportionality between density and compressibility is not exact, and there is a slight dependence of sound velocity on the gas pressure. Sound speed is slightly dependent on pressure only because air is not quite an ideal gas.
In addition, for different gases, the speed of sound is inversely dependent on square root of the mean molecular weight of the gas, and affected to a lesser extent by the number of ways in which the molecules of the gas can store heat from compression, since sound is a type of compression. Humidity has a small but measurable effect on sound speed in air (causing it to increase by about 0.1%-0.6%), because oxygen and nitrogen molecules of the air are replaced by lighter molecules of water. This is a simple mixing effect.
The speed of sound may be expressed, in the case of gases only, in terms of a ratio of both density and pressure.
In gases, adiabatic compressibility is directly related to pressure through
the
heat capacity ratio (adiabatic index) (),
and pressure and density are inversely related at a given temperature and
composition, thus making only the latter independent properties (temperature,
molecular composition, and heat capacity ratio) important.
Values of
based on
approximations (particularly
) are in many
cases not sufficiently accurate for practical engineering calculations such as
flow rates through pipes and valves. An experimental value should be used rather
than one based on this approximation, where possible. Values for
 are readily
available and recorded, but values for
need to be
determined via relations such as:
are readily
available and recorded, but values for
need to be
determined via relations such as:

At 1 atm real air is very well described by the ideal gas approximation.
Making the following numerical substitutions:
 is the molar gas constant
in J/mole/Kelvin;
is the molar gas constant
in J/mole/Kelvin;
 is the mean molar mass of dry
air, in kg;
is the mean molar mass of dry
air, in kg;
is the Temperature in Celsius degrees
If ideal diatomic gas value
is assumed
to be 7/5 = 1.4000 exactly

Using the first two terms of the Taylor expansion, this equation can be approximated, near 0ºC, by


| Temperature | Speed of sound | Density of air | Acoustic impedance |
|---|---|---|---|
 in °C
in °C |
c in m·s−1 | ρ in kg·m−3 | Z in N·s·m−3 |
| +35 | 351.88 | 1.1455 | 403.2 |
| +30 | 349.02 | 1.1644 | 406.5 |
| +25 | 346.13 | 1.1839 | 409.4 |
| +20 | 343.21 | 1.2041 | 413.3 |
| +15 | 340.27 | 1.2250 | 416.9 |
| +10 | 337.31 | 1.2466 | 420.5 |
| +5 | 334.32 | 1.2690 | 424.3 |
| 0 | 331.30 | 1.2922 | 428.0 |
| −5 | 328.25 | 1.3163 | 432.1 |
| −10 | 325.18 | 1.3413 | 436.1 |
| −15 | 322.07 | 1.3673 | 440.3 |
| −20 | 318.94 | 1.3943 | 444.6 |
| −25 | 315.77 | 1.4224 | 449.1 |
Calculated values for
 (above) have been found to vary slightly from experimentally determined values.
The temperature of the air varies with altitude, giving the following variations in the speed of sound with altitude using the standard atmosphere
| Altitude | Temperature | m·s−1 |
| Sea level | 15 °C | 340 |
| 11,000 m−20,000 m (Cruising altitude of commercial jets, and first supersonic flight) |
−57 °C | 295 |
| 29,000 m (Flight of X-43A) | −48 °C | 301 |
Density and pressure decrease smoothly with altitude, but temperature does not. The speed of sound depends only on the complicated temperature variation at altitude and can be calculated from it, since isolated density and pressure effects on sound speed cancel each other. Speed of sound increases with height in two regions of the stratosphere and thermosphere, due to heating effects in these regions.

The standard equations for the speed of sound apply with reasonable accuracy only to situations in which the wavelength of the sound wave is considerably longer than the mean free path of molecules in a gas. The limitations of the concept of speed of sound due to extreme attenuation are also of concern. The attenuation which exists at sea level for high frequencies applies to successively lower frequencies as atmospheric pressure decreases, or as the mean free path increases. For this reason, the concept of speed of sound (except for frequencies approaching zero) progressively loses its range of applicability at high altitudes.
The medium in which a sound wave is travelling does not always respond adiabatically, and as a result the speed of sound can vary with frequency.
The molecular composition of the gas contributes both as the mass (M) of the
molecules, and their heat capacities, and so both have an influence on speed of
sound. In general, at the same molecular mass, monatomic gases have slightly
higher sound speeds (over 9% higher) because they have a higher
(5/3 =
1.66) than diatomics do (7/5 = 1.4). Thus, at the same molecular mass, the sound
speed of a monatomic gas goes up by a factor of
 = 1.091...
This gives the 9% difference, and would be a typical ratio for sound speeds at room temperature in helium vs. deuterium, each with a molecular weight of 4. Sound travels faster in helium than deuterium because adiabatic compression heats helium more, since the helium molecules can store heat energy from compression only in translation, but not rotation. Thus helium molecules (monatomic molecules) travel faster in a sound wave and transmit sound faster. (Sound generally travels at about 70% of the mean molecular speed in gases).
Note that in this example we have assumed that temperature is low enough that heat capacities are not influenced by molecular vibration (see heat capacity). However, vibrational modes simply cause gammas which decrease toward 1, since vibration modes in a polyatomic gas gives the gas additional ways to store heat which do not affect temperature, and thus do not affect molecular velocity and sound velocity. Thus, the effect of higher temperatures and vibrational heat capacity acts to increase the difference between sound speed in monatomic vs. polyatomic molecules, with the speed remaining greater in monatomics.
In liquids, as in gases, only compression waves can be transmitted and so, the process is the same as in gases. The speed of a compression wave in any fluid is determined by the medium's compressibility and density.
In a fluid the only non-zero stiffness is to volumetric deformation (a fluid does not sustain shear forces).
Hence the speed of sound in a fluid is given by

where
K is the bulk
modulus of the fluid.
In fresh water, sound travels at about 1497 m/s at 25 °C.
In salt water that is free of air bubbles or suspended sediment, sound travels at about 1560 m/s. The speed of sound in seawater depends on pressure (hence depth), temperature (a change of 1 °C ~ 4 m/s), and salinity (a change of 1‰ ~ 1 m/s), and empirical equations have been derived to accurately calculate sound speed from these variables. Other factors affecting sound speed are minor. Since temperature decreases with depth while pressure and generally salinity increase, the profile of sound speed with depth generally shows a characteristic curve which decreases to a minimum at a depth of several hundred meters, then increases again with increasing depth.

When sound spreads out evenly in all directions in three dimensions, the intensity drops in proportion to the inverse square of the distance. However, in the ocean there is a layer called the 'deep sound channel' or SOFAR channel which can confine sound waves at a particular depth.
In the SOFAR channel, the speed of sound is lower than that in the layers above and below. Just as light waves will refract towards a region of higher index, sound waves will refract towards a region where their speed is reduced. The result is that sound gets confined in the layer, much the way light can be confined in a sheet of glass or optical fiber. Thus, the sound is confined in essentially two dimensions. In two dimensions the intensity drops in proportion to only the inverse of the distance. This allows waves to travel much further before being undetectably faint.
Acoustic pulses travel great distances in the ocean because they are trapped in an acoustic "wave guide". This means that as acoustic pulses approach the surface they are turned back towards the bottom, and as they approach the ocean bottom they are turned back towards the surface. The ocean conducts sound very efficiently, particularly sound at low frequencies, i.e., less than a few hundred Hz.
A similar effect occurs in the atmosphere. Project Mogul successfully used this effect to detect a nuclear explosion at a considerable distance.
In fluids, only the medium's compressibility and density are the important factors, since fluids do not tolerate shear stresses. In heterogeneous fluids, such as a liquid filled with gas bubbles, the density of the liquid and the compressibility of the gas affect the speed of sound in an additive manner, as demonstrated in the hot chocolate effect.
The speed of sound in a plasma for the common case that the electrons are hotter than the ions (but not too much hotter) is given by the formula

where
 is the ion mass
 is the ratio of
ion mass to proton
mass
is the ratio of
ion mass to proton
mass

 is the electron
temperature
is the electron
temperature
Z is the charge state
k is
Boltzmann's constant
is the
adiabatic index
In contrast to a gas, the pressure and the density are provided by separate species, the pressure by the electrons and the density by the ions. The two are coupled through a fluctuating electric field.
In solids, there are compression or longitudinal waves analogous to those in fluids and transverse waves, called a shear wave due to elastic deformation of the medium perpendicular to the direction of wave travel. The direction of shear-deformation is called the 'polarization' of this type of wave. In general, transverse waves occur as a combination of a pair of orthogonal polarizations.
In solids, the speed of a longitudinal sound wave is determined by the medium's compressibility, density (as in fluids) and by the additional factor of shear modulus.
The speed of transverse or shear waves is determined only by the solid material's shear modulus and density.
These different waves (compression waves and the different polarizations of shear waves) may have different speeds at the same frequency. An extreme example being an earthquake, where sharp compression waves arrive first at an observer, and rocking transverse waves seconds later.
In a solid, there is a non-zero stiffness both for volumetric and shear deformations. Hence, it is possible to generate sound waves with different velocities dependent on the deformation mode. Sound waves generating volumetric deformations (compressions) and shear deformations are called longitudinal waves and shear waves, respectively.
In earthquakes, the corresponding seismic waves are called P-waves and S-waves, respectively. The sound velocities of these two type waves propagating in a homogeneous 3-dimensional solid are respectively given by:


where
K is the bulk
modulus,
G and shear
modulus,
Y is the
Young's modulus,
 is
Poisson's ratio.
is
Poisson's ratio.
The last quantity is not an independent one, as
 .
.
Note that the speed of longitudinal/compression waves depends both on the compression and shear resistance properties of the material, while the speed of shear waves depends on the shear properties only.
Typically, compression or P-waves travel faster in materials than do shear waves, and in earthquakes this is the reason that onset of an earthquake is often preceded by a quick upward-downward shock, before arrival of waves that produce a side-to-side motion.
For example, for a typical steel alloy, K = 170 GPa, G = 80 GPa
and = 7700
kg/m3, yielding a longitudinal velocity cl of 6000
m/s. This is in
reasonable agreement with cl=5930 m/s measured experimentally
for a (possibly different) type of steel.
The shear velocity cs is estimated at 3200 m/s using the same numbers.
The speed of sound for longitudinal waves in stiff materials such as metals is sometimes given for "long, thin rods" of the material in question, in which the speed is easier to measure. In rods where their diameter is shorter than a wavelength, the speed of pure longitudinal waves may be simplified and is given by:

This is similar to the expression for shear waves, save that Young's modulus replaces the shear modulus. This speed of sound for longitudinal waves in long, thin rods will always be slightly less than the 3-D, longitudinal wave speed in an isotropic materials, and the ratio of the speeds in the two different types of objects depends on Poisson's ratio for the material.
For any periodic wave the wavelength is the distance from a given point in the wave to the corresponding point in the next cycle of the wave, frequently represented by the Greek letter lambda (λ). It may also be thought of as the distance the wave travels in one cycle or period.
Wavelength is related to frequency through the wave speed: the speed or velocity (v) of the wave in any medium equals the frequency (f) times the wavelength (λ):
v = f ·λ
Some examples of the wavelengths and frequencies of various waves:
| Mechanical waves | frequency | wavelength |
| lowest audible C | 16.4 Hz | 2103.1 cm = 21 m |
| lowest C on piano | 32.7 Hz | 1051.5 cm = 10.5 m |
| middle C on piano | 261 Hz | 129.5 cm = 1.3 m |
| violin A string | 440 Hz | 76.2 cm = 7.6·10-1 m |
| C four octaves above middle C | 4186 Hz | 8.3 cm = 8.3·10-2 m |
| highest audible tone | 20000 Hz | 1.7 cm = 1.7·10-2 m |
|
wavelengths and
frequencies of various sound examples |
||
| Electromagnetic waves | frequency | wavelength |
| Gamma ray | 3·1021 Hz | 10-4 nm = 10-13 m |
| X ray | 3·1017 Hz | 1 nm = 10-9 m |
| Ultraviolet light | 3·1016 Hz | 10 nm = 10-8 m |
| Violet light | 7.5·1014 Hz | 400 nm = 4·10-7 m |
| Red light | 4.3·1014 Hz | 700 nm = 7·10-7 m |
| Infrared heat | 3·1013 Hz | 10 μm = 10-5 m |
| Microwave | 3·1010 Hz | 1 cm = 10-2 m |
| Radio wave | 3·105 Hz | 1 km = 103 m |
|
wavelengths and
frequencies of various electromagnetic examples |
||
The pattern of the variation that propagates, usually displayed as a two-dimensional graph of amplitude against time is the Waveform. For periodic waveforms, a single cycle or period completely defines the waveform.
The simplest waveform is the sine wave. More complex waveforms can be constructed from sine waves of various frequencies by the Law of Superposition. Other common simple waveforms are the triangle wave, square wave, sawtooth wave or pulse wave.
Waves are described by a wave equation which sets out how the disturbance proceeds over time. The mathematical form of this equation varies depending on the type of wave.
A mechanical vibration in an elastic medium, propagates through such medium and lasts in the time. We see such propagation in the water and we call it a wave. Similarly, the graphic representation of the oscillation as it varies in the space or time is called a wave.
Mechanical waves may be of three sorts, transverse, longitudinal both through the body of an object, and surface waves.
 Transverse
A transverse wave is a moving wave that consists of oscillations occurring perpendicular (or right angled) to the direction of energy transfer. For transverse waves in matter the displacement of the medium is perpendicular to the direction of propagation of the wave.
A ripple on a pond and a wave on a string are easily visualized transverse mechanical waves. Light is an example of a electromagnetic transverse wave (an electromagnetic wave with properties of a transverse wave). Sound waves in solids can also be transverse.
Because (in the three-dimensional space) there are two independent directions perpendicular to the direction of wave propagation, there are two independent directions in which oscillations can occur. These phenomena of simultaneous motion in two transverse directions exhibit a phenomenon called polarization. Another property exhibited only by transverse waves is the birefringence.
 Longitudinal
Longitudinal waves have the same direction of vibration as their direction of travel, which means that the displacement of the medium is parallel (in the same, or the opposite direction), to the propagation of the wave. Mechanical longitudinal waves are also called compression waves. A wave along the length of a stretched Slinky toy, where the distance between coils increases and decreases, is a good visualization.
Nevertheless, as transverse waves are easier to display graphically in two dimensions, longitudinal waves are usually shown as if they were transverse waves.
Longitudinal waves include sound waves in a fluid (liquid or gas) and seismic primary waves (P-waves).
Longitudinal waves do not have polarization because the medium vibrates only along the direction in which the waves are travelling.
This type of wave travels along a surface that is the interface between two differing media, usually two fluids with different densities. There are several types of surface waves, mainly studied in seismology and ocean sciences. They can have characteristics of longitudinal and transverse waves simultaneously because the particles perform complex movements, among them, circles are the simplest.

Polarization is a property of waves that can oscillate with more than one orientation and so, it is a particular property of the transverse waves. If you anchor one end of a string and hold the other end in your hand, you can create transverse waves by moving your hand up and down. Notice though, that you can also launch waves by moving your hand side-to-side. That is, there are two independent directions in which wave motion can occur. These phenomena of simultaneous motion in two transverse directions exhibit a phenomenon called polarization.
The particular combination of the oscillations in those two transverse directions give the different types of polarization:
Linearly and circularly polarizations can be considered special cases of elliptically polarized waves. The nature of elliptical, circular and out-of-reference-plane linear polarization is often understood by thinking the oscillation as being divided into two components which are at right angles to each other.


For ease of visualization, polarization states are often specified in terms of the polarization ellipse, specifically its orientation and elongation. A common parameterization uses the orientation or tilt angle, ψ, the angle between the major semi-axis of the ellipse and the x-axis and the ellipticity, ε, the major-to-minor-axis ratio (also known as the axial ratio). The ellipticity angle, χ = arccot ε= arctan 1/ε, is also commonly used.

An ellipticity (ε) of zero or infinity corresponds to linear polarization and an ellipticity of ε=1 corresponds to circular polarization.
In some circumstances, confined electromagnetic waves can also present radial and azimuthal polarizations:

Sound waves are alternations of sound pressure or particle displacement following one another in cycles of compression and rarefaction through a medium such as air. On striking the ear, oscillations whose frequency lies within the audible range are heard as sound.
A sound wave of extremely low frequency is called infrasonic vibration. It cannot be heard in the conventional sense, but is rather felt as a vibration. The major effect of such sound is its ability to cause vibration in any mechanical object or structure, particularly one which is poorly damped or which has a large surface area in contact with the vibration.
Vibration is easily confused with sound because it often creates other sounds. Also, it may include low frequency components which are in fact heard as sound, but which may also induce vibration in the cavities of the body.
Because vibrations in solids can create sound waves in the surrounding fluid (usually the air), from the physical point of view all the mechanical oscillations in an elastic medium are studied as being part of the same type of phenomenon. From this point of view, sound waves are defined as any vibrations in pressure, particle displacement, and particle velocity propagated in an elastic medium.
While solids transmit both transverse and longitudinal, liquids and gases transmit only longitudinal mechanical waves.
Sound waves in a gas or liquid are always longitudinal and do not have polarization, however, in a solid medium sound waves can be transverse. In this case, the polarization is associated with the direction of the shear stress in the plane perpendicular to the propagation direction. The study of sound waves is thus largely concerned with longitudinal waves where the amplitude variations are in the direction of propagation.
Heard sounds corresponding to a periodic waveform have a pitch associated with them. Conversely, aperiodic waveforms have no such regularity or periodicity and may have ambiguous pitch (inharmonic) or may be classified as noise.
The waveform represents the behaviour of the sound in the time domain, and since its shape is indicative of the frequency content of the sound, waveform is sometimes used synonymously with timbre, although all contributing factors to timbre cannot be understood simply in terms of the waveform.
The speed or velocity (v) of sound in any medium equals the frequency (f) times the wavelength (λ):
v = f ·λ

Scales for wavelength to
frequency conversion
(for the speed of sound in air of 343 m/sec)
A mode of coherent mechanical energy transfer, usually referring to the transfer of energy from the sound source to the surrounding medium. Sound PROPAGATION, on the other hand, is the movement of SOUND WAVEs through a medium.
The flared horn of a trumpet or a LOUDSPEAKER can be called acoustic radiators. Each is designed such that a minimum of energy is wasted in the transmission process by being reflected back on itself, e.g. back into the tube of a trumpet. However, many objects not designed to radiate sound do so as a by-product of their internal processes, and often contribute to the AMBIENT NOISE LEVEL of the environment, such as is the case with all motors and machinery.
The atmosphere exerts pressure on all objects in it. When a vibrating body moves in air, it creates slight disturbances of the AMBIENT atmospheric pressure. The AMPLITUDE of these pressure variations (that is, their maximum displacement from the ambient atmospheric pressure) is called the sound pressure variation, whereas the effective pressure variation is 0.707 the maximum value (see ROOT MEAN SQUARE). The oscillating variations in sound pressure (called the WAVEFORM of the sound) PROPAGATE in the form of a SOUND WAVE.
The term 'compression' or condensation is used to indicate that part of a SOUND WAVE where the pressure is greater than the normal atmospheric pressure. It is the opposite of RAREFACTION.
RAREFACTION is the part of a SOUND WAVE where the pressure is less than the normal atmospheric pressure. RAREFACTION is the opposite of COMPRESSION. The displacement of air particles within a CYCLE involves alternations of compressions and rarefactions to produce sound.

When the amplitude of the vibrating body, such as a tuning fork, is greatest, its velocity is zero (that is, it has reached its outer limit of displacement and is momentarily motionless before returning in the opposite direction). If the velocity is zero, so is the pressure it exerts on the medium (e.g. air) around it. Velocity (and therefore pressure) is greatest mid-way between the maximum displacement of the vibrating body, and we can graph the resulting relationship between amplitude and sound pressure in the following way:

Sound pressure variation of a sine wave showing the PHASE relationship between pressure and particle displacement.
Sound pressure may be measured in dynes per square centimeter (dynes/cm2) or Newtons per square meter (N/m2) where 1 N/m2 = 10 dynes/cm2 @ 10-5 atmospheric pressure. See Appendix D for the conversion of pressure ratios to decibels.
It is the sound pressure rather than the actual physical INTENSITY of the wave which our EARDRUMs and MICROPHONEs react to. SOUND INTENSITY is proportional to the square of the sound pressure and so we may calculate intensity (which is difficult to measure) by measuring sound pressure (which is relatively simple to measure).
The particles or molecules of a medium are displaced from their random motion in the presence of a SOUND WAVE, and are set into OSCILLATION by the frequency associated with the wave. The speed of the particle during displacement is called the particle velocity, and its relation to the SOUND PRESSURE p is given by the following relation:
p = r . c . u
where r is the density of the medium, c is the SPEED OF SOUND, and u is the particle velocity which is the ROOT MEAN SQUARE of the instantaneous particle velocities over a time interval at the given position. The AMPLITUDE of the displacement d is related to the particle velocity by the equation:
d = u / 2pf
where f is the frequency of the wave. These displacements are very small, being, for example, of the order of one-millionth of an inch in the case of normal conversation at 10 feet.
The acoustic impedance Z of a surface or medium is the ratio of the amplitude of the SOUND PRESSURE p and the amplitude of the PARTICLE VELOCITY v of an acoustic WAVE that impinges on the surface or medium. By analogy to Ohm's law for electrical impedance,
Z = p / v
For air, Z = r . c where r is the density and c the SPEED OF SOUND. The numerical value of Z for air is 43 g/cm2 -sec. If a sound wave changes media, the ratio of the acoustic impedances of the media determines the efficiency of the energy transfer. The acoustic impedance of the eardrum, for instance, corresponds well with that of the auditory canal, guaranteeing maximum efficiency of energy transfer, but it does not correspond well with air. The PINNA may be described as an impedance matching device between the air and the auditory canal. Likewise, the flared end of a trumpet results in less energy being lost by being reflected back down the tube of the instrument.
Surfaces may be thought of as falling into two groups: those that are impervious to the passage of air, and those that are not. The first group includes most structural materials (brick, concrete, etc.), the second group includes materials such as foams, acoustic tiles, etc. High impedance materials are found in both groups. For example, both concrete and densely packed glass fibre are high impedance materials relative to air, whereas grass and some foams are low impedance surfaces.
The rate of repetition of the CYCLEs of a periodic quantity, such as a SOUND WAVE. Thus, frequency is the inverse of the PERIOD. More generally, frequency can be thought of as the rate of change of PHASE.
See also: CLICK, LAW OF UNCERTAINTY.
Frequency is denoted by the symbol f, and is measured in hertz (Hz) - formerly called cycles per second (cps or c/s) - kilohertz (kHz), or megahertz (mHz).
See diagrams under RADIO SPECTRUM, SIMPLE HARMONIC MOTION, SPECTRUM.
The only sound which consists of a single frequency is the pure SINE TONE such as produced by a sine wave OSCILLATOR or approximated by a tuning fork. All other sounds are complex, consisting of a number of frequencies of greater or lesser intensity. The frequency content of a sound is its SPECTRUM.
See: COMPLEX TONE, CRITICAL BANDWIDTH, EIGENTON, FORMANT, FUNDAMENTAL, HARMONIC, INHARMONIC, INTERVAL, OCTAVE, PARTIAL, RESONANCE, SIDEBAND, SYMPATHETIC VIBRATION, TIMBRE.
The ear can hear all frequencies from approximately 20 to 20,000 Hz, this often being called the audible range, or range of hearing (see AUDIO FREQUENCY). The FREQUENCY RESPONSE of the healthy ear is documented by the EQUAL LOUDNESS CONTOURS. Persons with HEARING LOSS due to age (PRESBYCUSIS) or other causes have a reduced sensitivity to usually the high frequencies. See diagram under AUDIOGRAM.
Compare: INFRASONIC, ULTRASONIC, VIBRATION.
The subjective sense of frequency is called PITCH. That is, frequency is an ACOUSTIC variable, whereas pitch is a PSYCHOACOUSTIC one. For the relation between musical pitches and frequency, see Appendix C.
See also: CONCERT PITCH, SCALE, TEMPERED TUNING, TUNING, VIBRATO.
Any FREQUENCY in the audible RANGE, usually between 20 and 20,000 Hz, and often referring to the frequency of AUDIO signals. Also called the audio spectrum.
Compare: INFRASONIC, RADIO SPECTRUM, ULTRASONIC. See: MODULATION, SPECTRUM.
Sound at frequencies above the audible range, namely above 20 kHz, audible only to various non-human species. Because of its very short WAVELENGTH in the megahertz range, ultrasound is used as a safe alternative to X-ray photography in medical diagnosis. Ultrasound scanning is sometimes called sonography.
SUPERSONIC was once used in acoustics synonymously with ultrasonic, but the former is now associated exclusively with speeds higher than that of sound.
See: AUDIO FREQUENCY, FREQUENCY, SONAR, SONICS. Compare: INFRASONIC, UHF.
Pertaining to VIBRATIONs and SOUND WAVEs whose FREQUENCY is too low to be heard as sound by the human ear, i.e. below about 20 Hz. The term is also used loosely to describe any low frequency sound.
Compare: AUDIO, BASS, PULSE, RUMBLE, SONICS, SUBSONIC, ULTRASONIC.
Infrasonic frequencies are felt as vibrations which, if intense enough, may result in feelings of nausea, vertigo and eventual black-out or internal hemorrhaging. Such sound or vibration is difficult to contain because of DIFFRACTION and RESONANCE effects, and the tendency for these vibrations to be transmitted through earth and building materials. The long-term physiological and psychological effects of constant exposure to these sounds are poorly understood.
See also: SYMPATHETIC VIBRATION, TRANSMISSION.
The intensity level of low frequency sounds may be measured by comparing C-scale and A-scale SOUND LEVEL METER readings. The difference between dBC and dBA levels indicates the amount of low frequency sound present (between 20 and 1000 Hz). Outdoor urban environments are characterized by a difference of at least 10 - 15 dB (dBC - dBA); motorized traffic and some buildings show 20 - 30 dB difference, whereas in natural environments, the difference may drop to 0 - 3 dB. Infrasonic sounds may also be analysed with a VIBRATION ANALYSER.
Compare: EQUAL LOUDNESS CONTOURS, NOISE CRITERION, PHON, SOUND TRANSMISSION CLASS.
Low frequency AUDIO SlGNALs are termed subaudio and are often used as control voltages in electronic SOUND SYNTHESIS.
See: AMPLITUDE MODULATION, FREQUENCY MODULATION, SOUND SYNTHESIZER.
Third-octave SPECTRUM analyses of sound sources with high intensities of low frequency energy. Although the infrasonic component cannot be analyzed by the same machine and is not shown here, it is quite possible that such energy exists in the region at the left of the graph, given the high levels from 20-100 Hz.
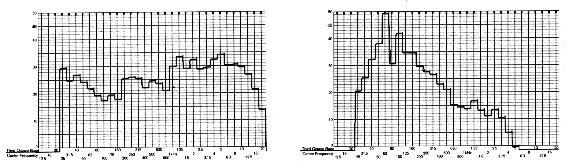 |
Left: Boiler-room water pumps, Cape Tormentine, N.B. Sound
Example
Sound
Example
Right: Diesel train shunting, Vancouver, B.C.Sound
Example
 |
Left: Inside accelerating subway car, Toronto, Ontario.Sound
Example
Right: Pulsating ventilation duct, Burrard Dry Docks, Vancouver, B.C.Sound
Example
 |
Left: Inside Volkswagen van on freeway.
Right: Industrial and city ambience of Vancouver harbour.Sound
Example
A single sound of definite, recognizable PITCH. It also refers to the SONORITY or the quality of TIMBRE of a particular sound or sounding instrument (e.g. "the tone of the cello"). In British musical usage the word is also employed to refer to the INTERVAL of a major SECOND.
In ACOUSTICS, the word is usually understood to mean a specific kind of sound with a FUNDAMENTAL plus (except in the case of a SINE TONE) its PARTIALs.
See: BEATS, COMBINATION TONES, COMPLEX TONE, SIMPLE TONE. Compare: CLICK, DRONE, HUM, NOTE, OVERTONE.
A TONE having a single PITCH, such as a flute note. It is also defined as a tone having only a single FREQUENCY, thereby making it equivalent to a SINE TONE, also called a pure tone.
Compare: COMPLEX TONE, NOTE, SINE WAVE.
Sound
Example: Complex tone (triangle wave).
Sound Example: Simple tone (sine wave).
A TONE with a single FREQUENCY, also known as a pure tone or sinus tone. Its WAVEFORM is that of a SINE WAVE, and is usually produced by a sine wave OSCILLATOR or by a computer. See: SIMPLE TONE.
PSYCHOACOUSTICS has traditionally used sine tones as stimuli in determining the various RESPONSEs of the auditory system.
See: AURAL HARMONICS, COMBINATION TONES, CRITICAL BANDWIDTH, DIFFERENTIAL THRESHOLD, EQUAL LOUDNESS CONTOURS, PHON, PITCH, SONE.
Sound
Example: Sine tone at 440 Hz.
A sinusoidal wave or function, that is, one moving in SIMPLE HARMONIC MOTION according to the function
A sin (2pft)
where A is the AMPLITUDE of the wave, f its FREQUENCY, and t is time.
According to the FOURIER THEOREM, any periodic WAVEFORM may be analyzed as the sum of a series of sine waves with frequencies in a HARMONIC SERIES, each of which has an amplitude and phase angle given by the Fourier coefficients. Since a sine wave has only a single frequency associated with it, it may be considered the simplest sound.
See: FOURIER ANALYSIS, FOURIER SYNTHESIS, GRANULAR SYNTHESIS, LAW OF SUPERPOSITION, SIMPLE TONE, SINE TONE, SOUND SYNTHESIS.

Two CYCLEs of a sine wave showing the amplitude of the pressure variation.
Sound
Example: Sine wave at 100 Hz.
A TONE having more than a single FREQUENCY component. For instance, a tone consisting of a FUNDAMENTAL and OVERTONEs or HARMONICs, may be said to be complex. Compare: SIMPLE TONE.
However, usage of this term is not consistent, and some writers refer to a complex tone as one having more than one PITCH, thereby emphasizing the perceptual dependence of the term. In that case, a sound may have many frequency components (such as any musical instrument note) but if it seems to have only a single pitch, it will not be called complex.
The LOUDNESS of complex tones is calculated by summation of the perceived loudness of each sinusoidal component. See Appendix F.
See also: AURAL HARMONICS, CRITICAL BAND, FOURIER ANALYSIS, FOURIER SYNTHESIS, HELMHOLTZ RESONATOR, LAW OF SUPERPOSITION, MASKING, periodic, RESIDUE, SOUND SYNTHESIS. Compare: broad band noise, PERCEIVED NOISE LEVEL.

Spectrum of a complex tone consisting of a fundamental and harmonics.
Sound
Example: Complex tone (triangle wave).
Sound Example: Simple tone (sine wave).
Spectrum (or frequency content) and timbre (or tone colour); its basic explanation for sounds composed of discrete frequencies;
The most common way of describing and measuring the oscillation of a sound wave is by means of the concept of "spectrum", or what might be called the "frequency content" of the sound. Of course, the magnitude of each frequency component is a necessary part of such a description, and therefore spectrum is not independent of magnitude considerations. The spectrum of a sound is one of the main determinants of the subjective perception of the "quality" or "colour" of the sound, more properly called its "timbre". This subjective impression of the sound is probably the most difficult to explain as it depends on many other variables as well. For convenience, we will introduce the topic in stages, with several subdivisions:
a) basic terms;
The FREQUENCY content of a sound or audio SIGNAL, often displayed as a graphic representation of amplitude (or INTENSITY LEVEL) against frequency. Three-dimensional displays of a spectrum add the time variation on the third axis (see below). The spectrum of a sound is a primary determinant of its perceived TIMBRE.
A PARTIAL spectrum consists of discrete frequencies known as OVERTONEs, HARMONICs or INHARMONICs. A continuous spectrum consists of NOISE components. The spectrum of a sound may be determined by a SOUND ANALYSER or by FOURIER ANALYSIS and is distributed over the audible range (20 to 20,000 Hz). A partial spectrum is also known as a line spectrum, where discrete frequencies are present. A continuous spectrum, on the other hand, shows frequencies continuously distributed over the audible range.
See: diagrams under broad band noise, FOURIER ANALYSIS, INFRASONIC, SPECTROGRAPH, white noise.
Analyzing the spectrum of a sound is a way of understanding its behaviour in the frequency domain, as opposed to its behaviour in the time domain, according to its WAVEFORM or ENVELOPE. The auditory system is designed to balance the simultaneous resolution of detail in both domains, as expressed by the LAW OF UNCERTAINTY.
The spectral envelope refers to the contour or shape of the spectrum, particularly when it shows the maximum strength of each frequency component during the sound.
The spectrum of a sound may be altered electronically by FILTERing or EQUALIZATION.
Spectrum may also refer to a RANGE of frequencies, as in the audio spectrum (see AUDIO FREQUENCY) or the RADIO SPECTRUM.
The first 32 partials of a HARMONIC SERIES shown as a line spectrum. The amplitude of each partial is inversely proportional to the partial number.

Line spectrum of the partials of a viola string, omitting their time variation.

Third-octave spectrum of the Salvatore Mundi bell, Salzburg. Peak intensities occur in the frequency bands centred on 200, 315 and 630 Hz, with a fundamental about 80 Hz.
Sound
Example: Salvatore Mundi.

Three-dimensional plot of a trumpet tone showing the amplitude envelope of the first 20 harmonics. From J. Beauchamp & A. Horner, "Synthesis of trumpet tones using a fixed wavetable and a centroid-controlled second order filter," Proceedings of the 1994 International Computer Music Conference, used by permission of the authors.
Timbre or tone QUALITY is determined by the behaviour in time of the FREQUENCY content or SPECTRUM of a sound, including its TRANSIENTs which are extremely important for the identification of timbre.
The presence and distribution of these frequency components, whether HARMONIC or INHARMONIC, and their onset, growth and DECAY in time (see FOURIER ANALYSIS), together with PHASE relations between them, combine to give every sound its distinctive tonal quality or timbre.
Compare: SONORITY, TONE. See also: PARAMETER, RESIDUE, WAVEFORM.
Often qualities of timbre are described by analogy to colour or texture (e.g. bright, dark, rough, smooth), since timbre is perceived and understood as a 'gestalt' impression reflective of the entire sound, seldom as a function of its analytic components.
See: GRAIN, SOUND OBJECT, VIBRATO.
With musical instruments, timbre is a function of the range in which the sound has its PITCH (see MASS), as well as its LOUDNESS, duration, and manner of articulation and performance. The same applies with speech, where timbre is the basic quality which allows one to distinguish between different voices, just as between different instruments or other sounds.
See also: FORMANT, OVERTONE, PARTIAL. Compare: VOLUME.
The tonal QUALITY or TIMBRE of a sound. The term is usually used in a subjective, descriptive manner, often with such adjectives as 'full' or 'rich'.
Timbre, on the other hand, can be accounted for in terms of frequency content (SPECTRUM) and its behaviour in time, and therefore can be regarded analytically as well as descriptively.
Compare: CONSONANCE, PRESENCE, SONOROUS, TONE, VOLUME.
Producing or characterized by rich or full sound, as implied by SONORITY or soniferous (see SONIFEROUS GARDEN). Similar, but archaic, terms include: sonorific, sonoriferous, sonification, sonance, sonation.
b) frequency analysis of sounds composed of individual or "discrete" frequencies;
If a sound is a complex of many TONEs of various FREQUENCY, AMPLITUDE and PHASE, repeating together in a basic CYCLE of definite frequency, the fundamental is the lowest frequency of this complex and corresponds to the unique PITCH heard in such a COMPLEX TONE.
The fundamental does not necessarily have the greatest amplitude, however, and even if missing (such as in the case of a low voice speaking through the carbon MICROPHONE of a telephone) the brain will still identify that frequency as the fundamental, called the periodicity pitch or missing fundamental. This ability of the auditory system is called fundamental tracking.

The dark line shows the sum of the second and third harmonics (F1, F2 respectively) whose periodicities (T1, T2 respectively) repeat at the same period (T0) as the fundamental. After J. Roederer, Introduction to the Physics and Psychophysics of Music, Springer, 1975.
In some percussion instruments with many INHARMONIC partials such as bells, the fundamental or hum note is different from the perceived pitch of the instrument called the strike note.
Sound
Example: Large bell, Salzburg, Austria, with a very low hum note and a
higher strike note.
In music the fundamental is the lowest tone in the HARMONIC series or the root tone of a chord.
See: FORMANT, FOURIER ANALYSIS, HARMONIC SERIES, sound example under LAW OF SUPERPOSITION, OCTAVE, OVERTONE, PARTIAL, RESIDUE, SUBHARMONIC. Compare: KEYNOTE SOUND.
In music, an adjective referring to HARMONY and its principles. In ACOUSTICS, when a vibrating object, such as a string, is set in motion, it vibrates both as a whole, with a FREQUENCY called the FUNDAMENTAL, and, with lesser intensity, in sections as well. If these smaller lengths are integer fractions (1/2, 1/3, 1/4, ...) of the total length of the string, their frequencies of OSCILLATION are called harmonics, and are integer multiples of the fundamental.
Other resonating frequencies which are not whole multiples of the fundamental may also be present, and are called PARTIALs. Bells, for instance, have many partials in their spectra, more than strings or pipes. It is the presence and relative strengths of harmonics and partials in a SPECTRUM that are largely responsible for the tone quality (TIMBRE) of any sound-producing body.
See also: FOURIER ANALYSIS, HELMHOLTZ RESONATOR, PHASE DIFFERENCE, RESIDUE, VOWEL. Compare: AURAL HARMONICS.
Note: In some texts, the term 'partial' refers to both harmonic and INHARMONIC resonating frequencies. In other words, all harmonics are then partials, but not all partials are harmonics. OVERTONE is often used to designate both harmonics and partials. However, it should be noted that while the fundamental is numbered as the first harmonic (as above), the first numbered overtone is the second harmonic (i.e. the OCTAVE above the fundamental). Compare: SUBHARMONIC.
The harmonics generated by a vibrating body may be represented in an ordered series called the HARMONIC SERIES. The combination of any subset of harmonics produces a harmonic spectrum (see LAW OF SUPERPOSITION). The first 16 harmonics of the series may be represented in musical notation and as a line SPECTRUM as follows:

The first 16 partials of the harmonic series in musical and acoustic notation. The plus and minus signs indicate that the 7th, 11th and 14th partials are lower than the notated pitch, and the 13th higher respectively. The other harmonics, other than the OCTAVEs, lie fairly close to the notes shown.
Sound
Example: Harmonic series (up to the 16th harmonic) synthesized with sine
waves at the frequencies indicated above.
Sound Example: Glissando through the harmonics of two cello strings.
An ordered set of frequencies which are integer multiples of a FUNDAMENTAL.
The first 32 partials of a HARMONIC SERIES shown as a line spectrum. The amplitude of each partial is inversely proportional to the partial number.
See: diagrams and sound examples under HARMONIC, LINEAR. See also: COMPLEX TONE, FOURIER ANALYSIS, FOURIER THEOREM, JUST TUNING, STANDING WAVES. Compare: SUBHARMONIC.
A FREQUENCY component in a SPECTRUM which is not an integer multiple of the FUNDAMENTAL, that is, it is an INHARMONIC overtone. However, in some texts, partial refers to both HARMONIC and inharmonic OVERTONEs. Bells, and other percussion instruments, have rich partials in their spectra.
Compare: FORMANT, SIDEBAND, SUBHARMONIC. See also: CRITICAL BAND, RESIDUE, TIMBRE, TONE, VOLUME.
Sound
Example: Bronze gamelan instrument.
Sound Example: Chinese tam-tam.
Sound Example: Large cathedral bell, Salzburg, Austria.
Any discrete frequency component in a SPECTRUM other than the FUNDAMENTAL. HARMONICs and PARTIALs are often called overtones; that is, overtones may be harmonic or INHARMONIC. However, it should be noted that the first overtone corresponds to the second harmonic in the HARMONIC SERIES.
Perceptually, an overtone is any PITCH component in a complex sound, such as that produced by an organ, violin or horn.
Compare: AURAL HARMONICS, COMBINATION TONES, FORMANT, SIDEBAND, SUBHARMONIC, TONE. See also: CRITICAL BAND, TIMBRE, VOLUME.
When the FREQUENCY of an OVERTONE is not an integer multiple of the FUNDAMENTAL, the overtone is said to be inharmonic and is called a PARTIAL; its WAVEFORM is aperiodic.
Instruments of the percussion group, bells, and gongs in particular, have overtones which are largely inharmonic. As a result, such sounds may have indefinite or multiple PITCHes associated with them.
Compare: HARMONIC, periodic, SUBHARMONIC. See: SPECTRUM, TIMBRE.
Sound
Example: Bronze gamelan instrument.
Sound Example: Chinese tam-tam.
Sound Example: Large cathedral bell, Salzburg, Austria.
c) other timbral determinants;
Any set of higher HARMONICs or PARTIALs in a SPECTRUM which cannot be individually identified because they activate a common area of the BASILAR MEMBRANE which is less than that corresponding to the CRITICAL BANDWIDTH.
In terms of FOURIER ANALYSIS, it is the part of a COMPLEX TONE whose Fourier components cannot be individually heard. The residue has an important role in the perception and recognition of TIMBRE. Therefore, HEARING LOSS in the upper frequency region (as in PRESBYCUSIS) decreases the accuracy of such perception. Compare: TRANSIENT.
If the components of the residue are harmonic, the PITCH ascribed to the spectrum will be that of the residue tone or missing fundamental (see FUNDAMENTAL for further discussion).
Ref.: J.F. Schouten, "The Residue: A New Component in Subjective Sound Analysis," Proceedings, Koninklijke Nederlandsche Akademie van Wetenschappen, 43, 3:356-365; Schouten et al., "Pitch of the Residue," Journal of the Acoustical Society of America, 34, 8 (part 2), pp.1418-24.
A sudden and brief fluctuation in a sound. The sound of a crack on a record, for example.
See: CLICK, ENVELOPE, TRANSIENT RESPONSE, WAVEFORM. Compare: GRAIN, IMPACT SOUND, PULSE.
In the initial part of any sound there occur a number of these fluctuations, for instance, the moment a violinist puts the bow to the string or the trumpeter tongues the notes. These are called onset transients and are important in identifying the sound source and its spatial location and TIMBRE. If these are SPLICEd out of a recording of the sound, it will easily be confused with other sounds.
See diagram under FOURIER ANALYSIS and FOURIER SYNTHESIS.
A linguistic example of transients is the initial CONSONANT in words such as: till, pill, kill, bill. The lack of intelligibility of speech in spaces with long REVERBERATION times (see DIFFUSE SOUND FIELD) is mainly due to the MASKing of such transients by reflected sound. Since onset transients often include high frequency components, loss of hearing sensitivity in this range (PRESBYCUSIS) results in decreased ability to distinguish between similar sounds or syllables. Compare: RESIDUE.
A transient sound is one whose average properties change in time such as a passing car, a SONIC BOOM, or an aircraft flying over.
Compare: INTERNAL DYNAMICS, STATIONARY SOUND.
The property of a SOUND OBJECT whose INTERNAL DYNAMICS have a regular, modulatory quality (see MODULATION), as opposed to irregular TRANSIENTs. The term was introduced by Pierre Schaeffer as part of a TYPOLOGY of the sound object. The emphasis therefore is on grain as a perceptual or psychoacoustic variable.
Grain is related to the texture of a sound, and includes such modulations as VIBRATO and TREMOLO, continuous or discontinuous repetitions, as in drum beats, or drawing a stick across an irregular surface.
Compare: BEATS, DRONE, MASS, PULSE, rustle noise, STATIONARY SOUND, STOCHASTIC PROCESS, TIMBRE.
Sound
Example: Guiro.
Sound Example: Chilean rain stick.
Sound Example: Carding wool.
A grain is also an elementary acoustic particle or 'quantum' in that it cannot be perceptually subdivided into smaller units (see LAW OF UNCERTAINTY). Its duration is normally less than 50 ms such that sequences of grains fuse perceptually into a continuous sound whose components are not separately identifiable.

Sine wave grains with a Gaussian envelope, the top example having a high frequency waveform, the lower example having a low frequency waveform, but both with the same duration.
In contrast with FOURIER SYNTHESIS which is based on SINE WAVE components with slowly changing amplitudes, granular synthesis is based on enveloped grains, usually deployed in high densities of hundreds or thousands of grains per second. The WAVEFORM of such grains may be synthetic (e.g. sine waves) or derived from environmental sounds. In the latter case, the technique is called granulation.
Compare: SOUND SYNTHESIS, SOUND SYNTHESIZER, TEMPOPHONE.
Sound
Example: Granular synthesis texture with increasing bandwidth of the
frequency of the component grains.
Sound Example: Granulation of three ferry horn blasts (original sound), with time stretching of the third event to 20 times its normal length.
The predominant frequency RANGE or BAND which the bulk or body of a sound occupies. The term was introduced by Pierre Schaeffer as part of a TYPOLOGY of the SOUND OBJECT. The emphasis therefore is on mass as a perceptual or psychoacoustic variable. A sound's mass is what allows it to stay recognizable under transposition or transformation such as FILTERing.
See also: FORMANT, GRAIN, SOUND EVENT, SPECTRUM. Compare: TIMBRE, VOLUME.
Mass is further distinguished by Schaeffer as tonal, complex or varied. For a note of stable INTONATION, perceived mainly in terms of PITCH, the mass is said to be tonal, whereas for a fixed but extended frequency range, which cannot be identified by a single pitch, such as in a gong or broad band noise, the mass may be called complex. When the mass is variable in range, as with a GLISSANDO, it is termed varied.
An integer submultiple or fraction of a FUNDAMENTAL. Whereas the HARMONIC SERIES consists of integer multiples of the fundamental, the subharmonic series consists of pitches related to the fundamental by ratios: 1/2, 1/3, 1/4, 1/5, 1/6, ...
Subharmonics do not normally occur in natural sounds, although the subharmonic f/2 may be generated by the cone of a LOUDSPEAKER.
Compare: HARMONIC, INHARMONIC, OVERTONE, PARTIAL, SIDEBAND.
d) Fourier analysis of sounds composed of discrete frequencies plus other representations.
The representation of a periodic sound or WAVEFORM as a sum of Fourier components (i.e. pure SINUSOIDAL WAVEs). According to the FOURIER THEOREM, periodic sound may be shown to consist of SINE WAVEs in the HARMONIC SERIES, where the Fourier coefficients give the AMPLITUDE and PHASE angle of each component.
Fourier analysis may be performed mathematically if the expression f(t) describing the waveform or COMPLEX TONE is known, or else by converting the sound to digital form by a computer which then analyzes it. The average SPECTRUM of an instrument may be obtained in this way by analyzing it during a representative section of its STATIONARY STATE. However, if every period of the sound is analyzed, it will be seen that the spectrum is always changing in time, i.e. the harmonic components in the spectrum are constantly changing in amplitude. A more general form of analysis for transferring a time-domain signal to the frequency domain is called the Fourier transform.
Compare: FOURIER SYNTHESIS, HELMHOLTZ RESONATOR, LAW OF SUPERPOSITION, SIMPLE HARMONIC MOTION, SOUND ANALYSER, TIMBRE.
As well, it appears that the ear performs Fourier analysis on incoming sounds, in that separate harmonics may be distinguished up to the point where they tend to fuse together, that is, at the point where the harmonics are separated by a distance equal to the CRITICAL BANDWIDTH, indicating that they activate the BASILAR MEMBRANE in the same region. However, in most cases only the first 5 to 7 harmonics may be heard separately, and only in sustained tones. See: RESIDUE.
The diagram below shows the results of Fourier analysis of every period of a short trumpet tone (0.16 sec. at 550 Hz). The time behaviour of the first seven harmonics is shown from right to left as the sound progresses. At no time is the spectrum perfectly stationary. The greatest variation is during the onset TRANSIENTs shown at the right.

Pitch synchronous analysis of a trumpet tone. These measurements are for a short tone (0.16 sec.) with a fundamental frequency near 550 Hz (C sharp). Time, measured in units of one pitch period, runs from right to left because the pitch-synchronous programs give more information on the attack (on right of plot) when proceeding backward in time. Seven harmonics are shown here (from M. Mathews and J.C. Risset, "Analysis of Musical-Instrument Tones", Physics Today, 1969, vol. 22, no. 2, p. 26, used by permission of the authors and the American Institute of Physics).
Three-dimensional plot of a trumpet tone showing the amplitude envelope of the first 20 harmonics. From J. Beauchamp & A. Horner, "Synthesis of trumpet tones using a fixed wavetable and a centroid-controlled second order filter," Proceedings of the 1994 International Computer Music Conference, used by permission of the authors.
The construction of a periodic signal on the basis of Fourier coefficients which give the AMPLITUDE and PHASE angle of each component sine wave HARMONIC. These coefficients are obtained through FOURIER ANALYSIS. The synthesis technique is also called additive synthesis.
As supported by the LAW OF SUPERPOSITION, sine tones of varying amplitudes will combine to form a complex harmonic SPECTRUM. If every period of sound has been subjected to Fourier analysis by a computer, then this information can be used to reproduce a sound indistinguishable from the original by means of Fourier synthesis. However, onset TRANSIENTs being Aperiodic are difficult to reproduce accurately. The more general form of transferring the frequency domain to the time domain is termed the inverse Fourier transform.
See: COMPLEX TONE, FOURIER THEOREM, HARMONIC SERIES, SINE WAVE. Compare: GRANULAR SYNTHESIS, SOUND SYNTHESIS.

Successive approximations of a sawtooth wave by addition of harmonics with amplitude inversely proportional to the harmonic number. The resultant waveform at each stage of addition is shown at right.
Sound
Example: Addition of the first 14 sine wave harmonics resulting in the
successive approximation of a sawtooth wave.
A mathematical theorem stating that a periodic function f(x) which is reasonably continuous may be expressed as the sum of a series of sine or cosine terms (called the Fourier series), each of which has specific AMPLITUDE and PHASE coefficients known as Fourier coefficients.
The application of this theorem to sound is known as FOURIER ANALYSIS and FOURIER SYNTHESIS. The theorem was developed by the French mathematician J.B. Fourier around 1800.
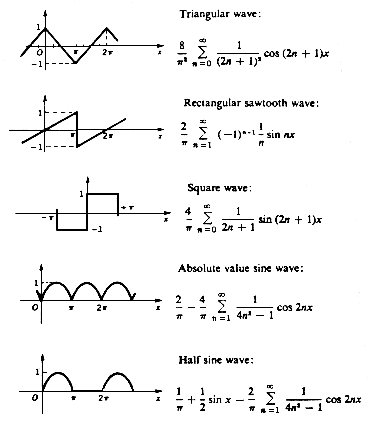
Fourier series of common WAVEFORMs.
See: PULSE WAVE, RECTIFICATION, SAWTOOTH WAVE, SINE WAVE, SQUARE WAVE, TRIANGLE WAVE.
A SOUND ANALYSER with graphic output showing the SPECTRUM or frequency content of a sound and its variation in time. It is commonly used for speech analysis, and is sometimes called a sonagraph or visible speech. The graphic output is called a spectrogram or sonagram.
Compare: LEVEL RECORDER, OSCILLOSCOPE, SONOGRAPHY, diagrams under FOURIER ANALYSIS.

Sound spectrograph (sonagraph). A sound of 2.4 sec duration is transferred to the magnetic disk and then repeatedly sampled as the disk rotates with the recording drum. The stylus passes a spark to the drum, etching the paper (from Winckel, Music, Sound and Sensation, Dover, 1967, p. 160, used by permission).
Spectrogram or sonagram of a two-second segment of speech, namely the phrase "I can see you." The dark areas show regions of strong intensity in the spectrum, such as FORMANTs and CONSONANTs.
A machine comprised of a FILTER system and a system for indicating the relative energy passed through each part of the filter. This measurement gives the distribution of energy of the applied signal as a function of frequency called the SPECTRUM of the signal.
See: SONOGRAPHY, SPECTROGRAPH. Compare: FOURIER ANALYSIS, HELMHOLTZ RESONATOR, LEVEL RECORDER, OSCILLOSCOPE, SOUND LEVEL METER.
There are many types of analysers. An Octave Band Analyser measures the intensity level for each of a set of octave bands, centred on 31.5, 63, 125, 250, 500, 1000, 2000, 4000, 8000 and 16,000 Hz. A Third-Octave Band Analyser divides the frequency spectrum into three bands per octave, the Tenth-Octave Band Analyser into ten bands per octave.
See broad band noise, INFRASONIC, SPECTRUM, white noise for examples of third-octave analyses. See: CENTRE FREQUENCY. Compare: CRITICAL BAND, Appendix E.
Other types of analysers include the Wave Analyser, which is a continuously variable analyser over the entire audio range; the Impact Noise Analyser for analysing IMPACT SOUNDs such as hammers or punch presses; and the Vibration Analyser, for analysing INFRASONIC VIBRATION.
STANDARD OCTAVE BAND FREQUENCIES
Centre Frequency (Hz) |
Effective Band (Hz) |
31.5 |
22.1 - 44.2 |
63 |
44.2 - 88.4 |
125 |
88.4 - 177 |
250 |
177 - 354 |
500 |
354 - 707 |
1,000 |
707 - 1,414 |
2,000 |
1,414 - 2,828 |
4,000 |
2,828 - 5,657 |
8,000 |
5,657 - 11,314 |
CENTRE FREQUENCIES FOR THIRD-OCTAVE BANDS
Centre Frequency |
Centre Frequency |
Centre Frequency |
(Hz) |
(Hz) |
(Hz) |
10 |
100 |
1,000 |
12.5 |
125 |
1,250 |
16 |
160 |
1,600 |
20 |
200 |
2,000 |
25 |
250 |
2,500 |
31.5 |
315 |
3,150 |
40 |
400 |
4,000 |
50 |
500 |
5,000 |
63 |
630 |
6,300 |
80 |
800 |
8,000 |
Resonance phenomena: the relation of frequency content to the nature and behaviour of the sound source;
The nature and behaviour of the sound producer, including the nature of its contact with the surrounding medium, determines a great deal of the nature of the resulting sound heard. Although this topic is more fully treated under Sound-Medium Interface, the implications of the so-called "natural modes of vibration" or "resonances" of objects and enclosures is so important for understanding frequency, spectrum and timbre, that we also include the relevant information here.
When a system with a natural vibrating FREQUENCY is stimulated by an outside force of the same frequency, the system can be set in a motion called VIBRATION (see SYMPATHETIC VIBRATION). As the frequency of the stimulus closely approaches that of the system, OSCILLATION occurs, which reaches a maximum AMPLITUDE at the natural resonant frequency.
Resonance can occur in any vibrating system, including electrical circuits, the sound boxes of musical instruments, rooms (see EIGENTON), the cavities of the human body, including the vocal tract (see FORMANT, VOWEL), and other objects (see RESONATOR). It can be regarded as a type of natural AMPLIFICATION in that the transfer of acoustic energy is made more efficient, as opposed to an electroacoustic AMPLIFIER where energy is added to the system.
See: ACOUSTIC FEEDBACK, FREQUENCY RESPONSE, HELMHOLTZ RESONATOR, RESONANCE CURVE, SOUNDBOARD, STANDING WAVES, VOLUME. Compare: ACOUSTIC RADIATION, ATTENUATION, DAMPING, FLAT, REVERBERATION.
Sound
Example: Knocking on the resonant body of a cello.
Sound Example: Complex resonances of a tam-tam.
Sound Example: Voice processed by a digital resonator tuned to C and G (text by Joy Kirstin, reading by Ellie Epp).
In the most basic sense, a resonator is a natural AMPLIFIER. It is usually a cavity or hollow body which will vibrate sympathetically with another vibrating system, such as the air through which the sound waves are travelling.
See: EIGENTON, HELMHOLTZ RESONATOR, RESONANCE, STANDING WAVES, SYMPATHETIC VIBRATION. Compare: ACOUSTIC RADIATION.
The vocal tract, for instance, amplifies certain frequency ranges called FORMANTs, and hence colours the sound produced by the vibration of the vocal cords. See: VOWEL.
The strings of a violin are connected to the hollow wooden body of the instrument by a bridge and the air between them. Sound waves from the strings will pass through the bridge and the air into the body causing the system to vibrate, thus amplifying the initial sound. See diagram under RESONANCE CURVE.
The resonant frequency of a tube or string depends on its length. For instance, the length of a tube open at both ends (or a string fixed at both ends) corresponds to a half WAVELENGTH of the resonant frequency, whereas if the tube is closed at one end, its length corresponds to a quarter wavelength.
Sound
Example: Knocking on the resonant body of a cello which acts as a resonator
for the sound of the strings.
A cavity-type RESONATOR so constructed that it will vibrate only at a particular FREQUENCY, giving off little energy to the outer medium, and therefore resonating for a considerable length of time. It was developed by the German physicist Hermann von Helmholtz in the 19th century to analyze the HARMONIC components of a COMPLEX TONE, but has since been superseded by more sensitive electronic devices.
However, large-scale Helmholtz resonators have been used recently by acousticians in perfecting the design of the celebrated Sydney Opera House. The basic design of the resonator as an enclosed air space with a single aperture is similar to the body of the violin or guitar.
Compare: AMPLIFIER, EIGENTON, FOURIER ANALYSIS, RESONANCE, SOUND ANALYSER, SOUNDBOARD, SYMPATHETIC VIBRATION.
An OSCILLATION produced in an object which resonates at the same FREQUENCY, or a HARMONIC multiple thereof, as that present in a sound wave in contact with the object.
See: EIGENTON, HELMHOLTZ RESONATOR, RESONANCE, RESONATOR. Compare: ACOUSTIC RADIATION.
For instance, various body cavities and organs may be set in VIBRATION by INFRASONIC vibration and low frequency sounds. Since most materials used for construction have low resonance frequencies, sounds in this range will be transmitted easily through such structures, such as is commonly experienced with BASS notes of music travelling through walls and ceilings.
A common illustration of sympathetic vibration is to sound a tuning fork and bring it close to, but not touching, another fork of the same frequency, which will then begin to vibrate sympathetically. If the forks are mounted on resonating boxes, the effect will be stronger and thus heard better. The same effect can be observed by shouting or singing near a set of undamped piano strings.
The pattern of RESPONSE of a resonant circuit, instrument or object when stimulated over a RANGE of the PARAMETER being measured. Normally the term applies to a measurement of the FREQUENCY RESPONSE. See also: RESONATOR.

Frequency response curves for (a) two violin strings, showing characteristic resonance regions, and (b) a loudspeaker which reproduces frequencies approximately equally.
The measure of the output of a sound-producing body stimulated with frequencies over a given RANGE, usually the entire range of hearing (20 to 20,000 Hz). Also called a RESONANCE CURVE.
The RESONANCEs of a musical instrument result in an uneven FREQUENCY response of that instrument, whereas for the ideal LOUDSPEAKER, the frequency response should be FLAT, that is, all frequencies should be reproduced equally well to achieve good FIDELITY.
See: EQUALIZATION, EQUAL LOUDNESS CONTOURS, FEEDBACK. Compare: AUDIOGRAM, SOUND LEVEL METER, SPECTRUM diagrams, TRANSIENT RESPONSE.
Frequency response curves for (a) two violin strings, showing characteristic resonance regions, and (b) a loudspeaker which reproduces frequencies approximately equally.
Sound
Example: Poor frequency response in a small loudspeaker reproducing a voice
at a fast food restaurant.
Sound Example: Amplified voice with boosted mid-range frequencies in a mobile public address system.
Sound Example: Amplified voices with boosted low frequencies at the Atlantic Winter Fair, Halifax, N.S.
A piece of wood used in stringed instruments, including keyboard instruments, which acts as a coupling device between the string and the air in order to AMPLIFY the sound. Since the amount of radiation varies with the size of the board, large ones are usually used to increase the sound output. The board will have many RESONANCE frequencies which are activated by the vibrating string; however, soundboards are designed so that each FREQUENCY produced by the string will sound equally loud.
See: FREQUENCY RESPONSE. Compare: AMPLIFIER, HELMHOLTZ RESONATOR, RESONATOR.
A similar device, called a sounding board, was used in many older churches above the pulpit to REFLECT and therefore amplify the speaker's voice.
(Ger.: eigen = belonging to; ton = tone) The fundamental RESONANCE mode of a room or enclosure. Parallel surfaces in a room reinforce, by REFLECTION, the waves of sound having a WAVELENGTH equal to twice that of the dimensions of the room. Also called the natural frequency of free vibration (see OSCILLATION), and the FREQUENCY of STANDING WAVES.
There are at least three modes of resonance in a room, which are not necessarily HARMONICally related (i.e. simple multiples of each other) since each dimension may be of different size. Bathrooms, for instance, have bare, highly reflective surfaces, and dimensions roughly equal to that of half wavelengths of frequencies in the human voice range. These frequencies will therefore be reinforced or amplified, but for a given room only certain frequencies will be affected in this way, depending on the particular wavelengths which fit it best. The room, then, is a natural AMPLIFIER of these frequencies. For large rooms, REVERBERATION is more important than these resonances.
Compare: HELMHOLTZ RESONATOR, SYMPATHETIC VIBRATION.
A characteristic RESONANCE region. A musical instrument may have several formant regions dictated by the shape and resonance properties of the instrument. The human voice also has formant regions determined by the size and shape of the nasal, oral and pharyngeal cavities (i.e. the vocal tract), which permit the production of different VOWELs and voiced CONSONANTs.
Formant regions are not directly related to the PITCH of the FUNDAMENTAL frequency and may remain more or less constant as the fundamental changes. If the fundamental is well below or low in the formant range, the quality of the sound is rich, but if the fundamental is above the formant regions the sound is thin and in the case of vowels may make them impossible to produce accurately - the reason singers often seem to have poor diction on the high notes.

Spectrum of the vowel "ah" showing three formant regions. The vertical lines represent harmonics produced by vibration of the vocal cords and based on a low fundamental. These harmonics are resonated by the vocal tract to create the vowel's characteristic spectral shape.
Phoneticians usually recognize at least two formant regions as uniquely characterizing the different vowels; however, a larger number are present but have less strength. Three formants are generally required to synthesize a vowel sound. These regions appear as dark horizontal bands on a SPECTROGRAM or amplitude peaks on a line SPECTRUM. The CENTRE FREQUENCY of a formant region is called the formant frequency, as listed in the table below.
Sung vowels are characterized by an additional formant called the singing formant in the range of 2500 to 3000 Hz. It is created by the special resonance of the vocal tract when the larynx is lowered, as practised by trained singers in the Western tradition. The formant not only gives sung vowels a characteristic colour, but also allows the voice to be heard over the accompaniment of instruments or even a full orchestra.
Compare: HARMONIC, INHARMONIC, OVERTONE, PARTIAL, TIMBRE.
Ref.: J. Sundberg, "The Acoustics of the Singing Voice," Scientific American, March 1977, pp. 82-91.
Formant |
heed |
head |
had |
hod |
haw'd |
who'd |
|
Men |
F1 |
270 |
530 |
660 |
730 |
570 |
300 |
F2 |
2290 |
1840 |
1720 |
1090 |
840 |
870 |
|
F3 |
3010 |
2480 |
2410 |
2440 |
2410 |
2240 |
|
Women |
F1 |
310 |
610 |
860 |
850 |
590 |
370 |
F2 |
2790 |
2330 |
2050 |
1220 |
920 |
950 |
|
F3 |
3310 |
2990 |
2850 |
2810 |
2710 |
2670 |
|
Children |
F1 |
370 |
690 |
1010 |
1030 |
680 |
430 |
F2 |
3200 |
2610 |
2320 |
1370 |
1060 |
1170 |
|
F3 |
3730 |
3570 |
3320 |
3170 |
3180 |
3260 |
Average resonance frequencies of the first three formants (F1, F2, F3) of the vowels of men, women and children (from Appleton and Perera, eds., The Development and Practice of Electronic Music, Prentice-Hall, 1975, p.42; after Peterson and Barney, Journal of the Acoustical Society of America, vol. 24, 1952, pp. 175-84; used by permission).
Aperiodic vibration, continuous spectra and noise;
Whereas most of the vibrational patterns considered so far were cyclic or periodic, a large class of vibrations in the environment - perhaps the most common even - are aperiodic, or even random, in the sense that they can only be described statistically. Aperiodic vibration is the most basic physical description of "noise". In terms of frequency content, aperiodic vibrations can only be described as having their energy spread out more or less continuously over some range or "band" of frequencies, perhaps even over the entire audible spectrum.
Frequencies which are within two definite limits, the middle of which is called the CENTRE FREQUENCY.
For example, in radio transmission, the standard AM broadcasting band extends from 550 to 1600 kHz, and the FM band extends from 87 to 108 mHz. With a qualifying adjective, the term can refer to a certain RANGE of frequencies roughly described by the adjective, e.g. broad band noise, narrow band noise.
See: chart under RADIO SPECTRUM. See also: BANDWIDTH, CRITICAL BAND, EQUALIZATION, FILTER, MASS, white noise. Compare: SIDEBAND.
The width of a BAND; the difference between the highest and lowest frequencies of a band, sometimes expressed in standard sizes, such as OCTAVE, half-octave, third-octave.
Technically, bandwidth is measured between the cut-off points of a FILTER or equalizer where the signal is attenuated -3 dB, also called the half-power points.
See: diagram under FILTER. See also: broad band noise, CENTRE FREQUENCY, EQUALIZATION, narrow band noise, SOUND ANALYSER, SOUND SYNTHESIS, SOUND SYNTHESIZER, TRANSIENT RESPONSE. Compare: INTERVAL.
The frequency in the middle of a BAND of frequencies, by which the band is identified together with the BANDWIDTH.
For instance, in the standard octave band from 177 to 354 Hz, the centre frequency is 250 Hz. See chart under SOUND ANALYSER, diagram under FILTER and Appendix E.
In electronic SOUND SYNTHESIS, it refers to the frequency of the unmodulated CARRIER signal or the middle of the frequency range to which EQUALIZATION is applied.
See: FILTER, FORMANT, SOUND SYNTHESIZER.
Sound classed as NOISE which has its energy distributed over a relatively small section of the audible range, such as HISS or SIBILANCE. The opposite of broad band or wideband noise. See broad band noise for further discussion.
Compare: HUM, white noise. See: BANDWIDTH.
Sound classed as NOISE which has its energy distributed over a large section of the audible range. Also called wideband noise, and the opposite of narrow band noise.
See: SPECTRUM. Compare: BACKGROUND NOISE, gaussian noise, INFRASONIC, white noise.
The output of most ventilation ducts is an example of steady broad band noise, and a jet engine flyover could be classed as TRANSIENT broad band noise. Most motors, including those in household appliances, produce a great deal of such noise, often with much of its energy in the higher frequency region where the human ear is the most sensitive (1 to 4 kHz). This aspect of the sound is not given special account in DECIBEL measurements, and thus such measurement systems as the PERCEIVED NOISE LEVEL, NOISE RATING, and NOISE CRITERION, and their derivatives and extensions have been devised.
See also: BOILERMAKER'S DISEASE, HEARING LOSS, MASKING, PHASING.
Third-octave spectrum analyses of various broad-band sound sources, some natural, others manmade.
 |
Left: Campus ambience, outdoors, outside University of British Columbia's Sedgewick Library. Tonal centres come from construction work in distance and from ventilation ducts atop a nearby building.
Right: Mechanical noise from ventilation equipment atop the Buchanan Building, U.B.C.
 |
Left: Office ambience, Buchanan Building, U.B.C., near ventilation duct in corridor.
Right: Surf, Wreck Beach, Vancouver.
|
Left: Domed horticultural space, flowing water, tropical plants and birds, MacMillan Conservatory, Vancouver.
Right: Wilderness lakeside ambience, Princess Lake, Jasper National Park, Alberta.
High frequency narrow band noise. Examples of hiss are the quiet 'sss' on analog MAGNETIC TAPE, and the sound created by ventilation ducts in offices.
Compare: AMBIENCE, RUMBLE, SIBILANCE, white noise. See also: EQUALIZATION, TREBLE.
The presence of strongly emphasized s, sh, ch, z, j sounds in speech called sibilants. These CONSONANTs are created by air moving through the vocal tract and being constricted by the position of the tongue and lips.
The SPECTRUM of sibilants is that of narrow band noise in the high frequency range (5-10 kHz) and therefore their perception is the first to be affected by hearing loss with age (PRESBYCUSIS). Sibilants may be unvoiced (i.e. without pitch) or voiced (i.e. with an added vibration of the vocal cords).
Compare: HISS, TREBLE, VOWEL, white noise.
A sound or signal consisting of all audible frequencies with equal intensity. The term is used analogously to the term 'white light' in optics which denotes the simultaneous presence of colours of all frequencies.
BANDs of FILTERed white noise are sometimes referred to as coloured noise, but the analogy to colour has not been applied systematically to sound. The term pink noise refers to a kind of NOISE where each OCTAVE band has the same intensity, and therefore does not sound as bright as white noise since the intensity of the SPECTRUM does not increase with higher frequencies.
Compare: BACKGROUND NOISE, broad band noise, gaussian noise, HISS, narrow band noise, random NOISE, RUMBLE, rustle noise, STOCHASTIC PROCESS.
A pure white noise signal may only be produced by a GENERATOR called a white noise generator and is often used as a sound source in SOUND SYNTHESIS. However, many sounds in nature and industry resemble white or coloured noise, such as water, wind, ventilation noise, or SIBILANCE such as 'ch' or 'sh'.
Because of its broad-band spectrum, white noise has strong MASKING abilities.

Third-octave spectrum of a white noise generator showing the characteristic increase of energy with frequency. By contrast, the nearly flat spectrum of the Athabaska River in Alberta is shown at right for comparison.
Sound
Example: White noise.
Sound Example: The Athabaska River, Alberta.
An OSCILLATION whose instantaneous magnitude is not specified for any given instant of time, but rather is described in terms of probability distribution functions such as the Gaussian. Also called gaussian noise.
Compare: BACKGROUND NOISE, rustle noise , STOCHASTIC PROCESS, white noise.
A probability distribution describing random fluctuations in a continuous physical process; named after Karl Friedrich Gauss, an 18th century German physicist. The distribution describes such STOCHASTIC PROCESSes as the random voltage variations in a carbon resistor due to thermal motion, or the so-called Brownian motion discovered by Robert Brown, the English botanist who in 1827 first studied the rapid and apparently random motions of minute particles in a gas as seen through a microscope. The formula for the distribution implies that large deviations from the mean become less probable according to exp(-x2). It is also known as a de Moivre or normal distribution.
When an electrical variation obeys a Gaussian distribution, such as in the case of thermal motion cited above, it is called Gaussian noise, or random noise. Other examples occur with some types of radio tubes or semi-conductors where the noise may be amplified to produce a noise generator. Note that in all of these cases, it is only the signal's amplitude fluctuating randomly that results in its being classified as Gaussian noise. Its SPECTRUM is not necessarily similar to that of white noise.
Compare: BACKGROUND NOISE, rustle noise.
Sound
Example: Gaussian noise produced with about 4000 pulses/sec.

Gaussian distribution showing the probability y of finding a deviation x from the mean (x = 0), according to the equation stated, where e is the base of natural logarithms, and s is the standard deviation. The probability of larger and larger deviations can be seen to decrease rapidly.
NOISE characterized by non-periodic or random PULSEs. The average time between pulses is called the rustle time, and when this is less than 0.3 ms, the result is white noise.
Many natural and instrumental sounds have randomly spaced components, such as rattles, drum snares, and other sounds with definable GRAIN. Because of the statistical aspect of AMBIENCE, it may also be described in this way.
Compare: BLEND, gaussian noise, random NOISE, STOCHASTIC PROCESS.
Pitch (that is, the subjective sense of frequency) and musical systems for organizing pitch;
The subjective response of the auditory system to periodic vibration is the sense of pitch, the parameter which the auditory system and the brain seem the most developed to detect. The study of pitch perception is an extremely large and important part of psychoacoustics, and the organization of pitches is common to all musical cultures. The adjustment of pitch called "tuning" , the limitation of musical material to specific sets of pitches, called "scales", and the concept of the distance between pitches, called the "interval", are central concerns of most musical systems. See also Appendix C.
The subjective sense of frequency is called PITCH. That is, frequency is an ACOUSTIC variable, whereas pitch is a PSYCHOACOUSTIC one. For the relation between musical pitches and frequency, see Appendix C.
The subjective impression of FREQUENCY, in the same sense that LOUDNESS is the subjective sense of the INTENSITY or AMPLITUDE of a sound. As such, pitch is a psychoacoustic variable, and the degree of sensitivity shown to it varies widely with people. Some individuals have a sense of remembered pitch, that is, a pitch once heard can be remembered and compared to others for some length of time; others have a sense of absolute pitch called PERFECT PITCH.
The pitch of a TONE or NOTE allows it to be placed in a musical SCALE; thus notes of a scale are often called pitches, and given names (A, B, C, C#, doh, re, mi, etc.).
See also: BASS, CONCERT PITCH, EQUAL TEMPERAMENT, FLAT, HARMONY, INTONATION, JUST SCALE, SHARP, TREBLE, UNISON.
The smallest degree of pitch discrimination between two pitches depends on their intensity and frequency range (see DIFFERENTIAL THRESHOLD). Under the best conditions, a person with good hearing can discriminate about 1400 different pitches, of which 120 are used in the western scale of equal temperament. The lowest pitch corresponds to the lowest frequency giving a sensation of TONE, around 20 to 30 Hz. The highest pitch depends on the highest audible frequency, which varies with age and especially noise exposure, but lies generally in the range of 15 to 20 kHz with younger people.
See: AUDIOGRAM, EQUAL LOUDNESS CONTOURS, INFRASONIC, PRESBYCUSIS, ULTRASONIC.
The sense of pitch depends on the intensity of the tone, as shown in the graph; below 1000 Hz, pitch tends to drop with increasing loudness, and above 1000 Hz, tends to rise. A tone must have a certain duration for pitch to be ascribed; if not, it is heard as a CLICK. The nature of the SPECTRUM of a COMPLEX TONE will affect the sense of pitch as well. A note rich in OVERTONEs will appear to have a more definite pitch than a SINE TONE of the same frequency and intensity, for instance. The pitch of the complex tone will correspond to its FUNDAMENTAL frequency. Compare: SIMPLE TONE.

The change in pitch in percent with loudness for various frequencies as indicated on the curves (from Olson, Music, Physics and Engineering, Dover, 1967, p. 251, after Stevens, used by permission).
In a very complex INHARMONIC spectrum, however, a sound may appear to have several pitch components. A sound with a continuously changing pitch is called a GLISSANDO. A pitch change caused by a moving sound source or observer is termed DOPPLER SHIFT.
See: HARMONIC, periodic, TIMBRE. Compare: FORMANT, MASS, RESIDUE.
Sound
Example: Simple tone (sine wave).
Sound Example: Complex tone (triangle wave) with the same frequency as the sine tone.
Sound Example: 1 kHz tone with duration of 40 ms being shortened to a 2 ms broad-band click where it loses its sense of pitch.
Sound Example: Cello note (harmonic spectrum).
Sound Example: Gamelan instrument (inharmonic spectrum).
The pitch ascribed to a complex tone or sound may not necessarily correspond to a frequency that is physically present in the sound. For instance, if a spectrum consists of harmonics beginning with the second or higher harmonic, the sound will still be heard as having the pitch of the fundamental, called the periodicity pitch or the missing fundamental (see FUNDAMENTAL for further discussion). In summary, Schouten has stated, "The pitch ascribed to a complex sound is the pitch of that component to which the attention, either by virtue of its loudness or of its contrast with former sounds is strongest drawn. Therefore the pitch of a complex sound may be different depending on the circumstances under which it is heard." See reference under RESIDUE.
The distance between two pitches is called an INTERVAL. However, equal frequency intervals do not always give the same sense of pitch distance, depending on the RANGE in which the interval is situated. For instance, a FIFTH in a high frequency range may seem to be a smaller pitch distance than a THIRD in a lower range. The MEL scale is an attempt to measure this variation. An alternative theory of pitch perception judges each note in terms of its chroma or distinctive tone colour and its tone-height. In this system, pitches may be arranged in a helix instead of a one-dimensional order, with the recurring loops of the helix at OCTAVE intervals. See: LINEAR.
The auditory system is often said to be 'phase deaf' in that constant PHASE DIFFERENCEs are not audible, and therefore phase information is often ignored, as in FOURIER SYNTHESIS. However, small time delays which are the equivalent of phase differences play an important role in BINAURAL HEARING. Similarly, constantly changing phase differences are audible in the phenomenon of secondary BEATS.
Although sometimes used interchangeably with the expression TONE, especially in North America, the term 'note', strictly speaking, refers to one of a set of signs with which music is notated or encoded. The various rhythmic values of the notes employed in Western music are listed here in a sequence that successively reduces their duration by half:

In general usage, note refers to any separate unit of sound, usually that with a definite PITCH.
See also: DYNAMICS, INTERVAL, METRONOME, RHYTHM, SCALE, TEMPO.
A unit of PITCH proposed by Stevens, Volkmann and Newmann in 1937. The mel scale is a scale of pitches judged by listeners to be equal in distance one from another. The reference point between this scale and normal frequency measurement is defined by equating a 1000 Hz tone, 40 dB above the listener's threshold, with a pitch of 1000 mels. Below about 500 Hz the mel and hertz scales coincide; above that, larger and larger INTERVALs are judged by listeners to produce equal pitch increments.
As a result, four octaves on the hertz scale above 500 Hz are judged to comprise about two octaves on the mel scale. Many musicians and psychologists prefer a two-dimensional representation of pitch by chroma or tone colour and tone-height.
Compare: CRITICAL BAND, SONE.
Sound
Example: Downward chromatic mel scale.

The mel scale as a function of frequency (from Appleton and Perera, eds., The Development and Practice of Electronic Music, Prentice-Hall, 1975, p. 56; after Stevens and Davis, Hearing; used by permission).
The standardization of one absolute musical PITCH in order to obtain, through consequent TUNING, identical pitches in all instruments for any note held in common by their respective RANGEs.
In Western music, the present day standard of concert pitch is a´ 440, i.e. the FREQUENCY of the pitch A in the first octave above middle C is 440 Hz (adopted, International Standards Association conference, London, 1939). Previously, the standard was a´ 435 (fixed, Paris Academy, 1859, as diapason normal; and confirmed, Vienna conference, 1885, as international pitch). Before that (although hoch Kammerton - chamber pitch, a semitone lower than a´ 440 - was the most common instrumental pitch from ca. 1700 to ca. 1820), different pitch levels were used, particularly for different instrumental ensembles, e.g. choir and organ, the town brass band, etc. A single account of the historical confusion of pitch standards in which every detail can be trusted does not, and may never, exist.
Compare: INTONATION, METRONOME, PERFECT PITCH, TEMPERED TUNING.
The ability to judge PITCH absolutely, without reference to another pitch or frequency. Also called absolute pitch. Perfect pitch appears to be an innate ability of some individuals, whereas related skills, such as remembered pitch or relative pitch which use other pitches as references, can be learned through musical practice.
Musical INTERVAL recognition can also be learned through ear training exercises. Compare: EAR CLEANING.
Compare: CONCERT PITCH, DIFFERENTIAL THRESHOLD, INTONATION, TUNING. See reference to chroma under PITCH.
The nature of the PITCH characteristic, usually of a performer of music in reference to a musical SCALE. Good and bad intonation refer to the degree of accuracy between what is actually performed and what is theoretically implied with respect to pitch. See: FLAT, SHARP.
In terms of TUNING, intonation refers to the process of adjusting the pitches used in a scale so that they are systematically organized.
See: EQUAL TEMPERAMENT, JUST INTONATION, PYTHAGOREAN SCALE, TEMPERED TUNING. Compare: CONCERT PITCH, PERFECT PITCH.
A sound whose PITCH varies continuously in time over a given range, such as a siren or the sound of a bowed or plucked string whose length is changing.
Compare: DOPPPLER EFFECT, DRONE, FLUTTER. See also: LAW OF UNCERTAINTY, MASS.
Sound
Example: Glissando on a cello string.
Sound Example: Long glissando of a siren, Alliance, Alberta.
A musical symbol
 denoting the lowering in
PITCH of a note by a
SEMITONE or half step. The term is also used colloquially to describe a note
played or sung at too low a pitch. Opposite of SHARP. See: INTONATION.
denoting the lowering in
PITCH of a note by a
SEMITONE or half step. The term is also used colloquially to describe a note
played or sung at too low a pitch. Opposite of SHARP. See: INTONATION.
The term flat is used differently in reference to electronic and ELECTROACOUSTIC devices. Here the FREQUENCY RESPONSE of a system, such as an AMPLIFIER, is said to be flat for the range of frequencies over which the GAIN of the system is equal. The importance of flat response is that all frequencies are reproduced equally well without any being under- or over-emphasized, as is the case with RESONANCE (see also RESONANCE CURVE, RESONATOR).
The frequency response of the ear is not flat (see EQUAL LOUDNESS CONTOURS), nor is that of rooms or other enclosed spaces (see EIGENTON). However, flat response is a desirable characteristic of magnetic tape, loudspeakers, amplifiers and microphones. BASS and TREBLE controls on an amplifier may be used to adjust the frequency response according to the ear's sensitivity (see EQUALIZATION) .
In studio recording, a flat is a movable BAFFLE covered with an insulating material and used to separate various sound sources.
A musical symbol ( # ) denoting the raising in PITCH of a note by a SEMITONE or half step. The term is also used colloquially to describe a note played or sung at too high a pitch. Opposite of FLAT.
See: EQUAL TEMPERAMENT, INTONATION.
The space or distance in PITCH or FREQUENCY between two TONEs or NOTEs. An interval may be defined by its position in a given SCALE, or by the frequency ratio between the two tones (as in scales of JUST INTONATION or the PYTHAGOREAN SCALE), or by the frequency difference measured in cents (as in an equal tempered system).
See also: MEL, QUARTER TONE, TEMPERAMENT, TEMPERED TUNING, Appendix C. Compare: PERFECT PITCH.
In the western 12 tone scale of EQUAL TEMPERAMENT, intervals are also sometimes referred to by the number of semitones comprising the interval. The most commonly named intervals are those of the UNISON, semitone, SECOND, THIRD, FOURTH, FIFTH, SIXTH, SEVENTH and OCTAVE, which have the following representations:
| Interval Name |
Just |
Intonation | Equal Temperament |
Number of Semitones |
Freq. Ratio |
Cents |
Cents |
||
| Unison | 1/1 |
0 |
0 |
0 |
| Semitone (minor second) | 16/15 |
112 |
100 |
1 |
| Second (major) | 9/8 |
204 |
200 |
2 |
| Third (minor) | 6/5 |
316 |
300 |
3 |
| Third (major) | 5/4 |
386 |
400 |
4 |
| Fourth | 4/3 |
498 |
500 |
5 |
| Fifth | 3/2 |
702 |
700 |
7 |
| Sixth (minor) | 8/5 |
814 |
800 |
8 |
| Sixth (major) | 5/3 |
884 |
900 |
9 |
| Seventh (minor) | 9/5 |
1018 |
1000 |
10 |
| Seventh (major) | 15/8 |
1088 |
1100 |
11 |
| Octave | 2/1 |
1200 |
1200 |
12 |
The second, third, sixth and seventh have major and minor forms; the unison, fourth, fifth and octave are called perfect; perfect or major intervals may be augmented (i.e. raised by a semitone); perfect and minor intervals may be diminished (i.e. lowered by a semitone). In 12 tone equal temperament, the augmented fourth and diminished fifth form the interval called the tritone which is comprised of 6 semitones (i.e. a half octave).The following chart shows these intervals in musical notation.

Sound
Example: Scale of equal temperament, heard melodically.
Sound Example: Scale of equal temperament, heard as intervals (major & perfect intervals only).
Sound Example: Scale of just intonation, heard melodically.
Sound Example: Scale of just intonation, heard as intervals (major & perfect intervals only).
An ordering of a system of PITCHes, usually in ascending FREQUENCY order. The distance between any two pitches or NOTEs is called an interval (see INTERVAL for comparative representations).
See also: INTONATION, TEMPERAMENT, TEMPERED TUNING, TUNING.
Many types of scales are used by different cultures, varying in the number of pitches contained in the scale (such as five in pentatonic scales, seven in the western diatonic scale, and twelve in the western scale of EQUAL TEMPERAMENT), and the specific pitches involved. In western usage, a scale of JUST INTONATION is based on integer frequency ratios, whereas a scale of equal temperament divides the OCTAVE into a number of equal intervals. See also: PYTHAGOREAN SCALE, Appendix C.
In some cultures the notes of the scale are rigidly adhered to pitches. Melodies move from one note to another avoiding any pitches in between, as is the practice in western art music. However, in most oriental and folk music, the notes of the scale are treated as reference points, and in performance, pitches in between, which are called microtones, are often used. In Indonesian gamelan music, the metallic instruments have fixed pitches, organized according to the pelog and slendro scales, but the exact tuning of each pitch varies between orchestras.
Variations in the ordering and intervals of a scale may result in different modes, such as the major and minor modes of the western scale. The scale may be characterized by its mode, the intervals it contains, sometimes the note it begins on, and occasionally whether it is treated in ascending or descending order. It may arise from a theoretical specification, as in western music, or from the available notes on a given instrument, or from a cultural tradition (as with the Indian raga scales which are specific to the raga).
Sound
Example: Scale of 12-tone equal temperament.
Sound Example: Scale of just intonation.
Sound Example: Pythagorean scale.
Sound Example: Gamelan scale.
The adjustment of the FREQUENCY of strings or pipes of musical instruments to conform to a given SCALE (see TEMPERED TUNING), or the adjustment of other instruments to such a tuned instrument (see CONCERT PITCH).
Compare: INTONATION, PERFECT PITCH, UNISON. See also: BEATS, HETERODYNE, TEMPERAMENT, TEMPOPHONE, Appendix C.
In a more general sense, tuning may be thought of (as it was in the medieval period, for instance) as an expression of the harmony or order of the universe. In this sense, then, the balancing of a SOUNDSCAPE may be thought of as a process of tuning, in which all elements are designed to be heard in balance.
See: SOUNDSCAPE DESIGN, SOUNDSCAPE ECOLOGY. Compare: SOUND POLLUTION.
Any system in which small changes in TUNING of the INTERVALs of a SCALE are introduced such that these intervals are no longer exact frequency ratios (e.g. the 3/2 of the FIFTH), as is the case with scales of JUST INTONATION or the PYTHAGOREAN SCALE.
See: EQUAL TEMPERAMENT, TEMPERED TUNING.
The process of adjusting or TUNING the FREQUENCY of tones in a SCALE. Usually the purpose of doing this is to reduce the number of tones in the scale, by going from frequencies based on exact ratios to those which produce equal INTERVALs.
See: EQUAL TEMPERAMENT, TEMPERAMENT. Compare: CONCERT PITCH, INTONATION, JUST INTONATION, PYTHAGOREAN SCALE.
Any system of TUNING in which the OCTAVE is divided into a number of equal INTERVALs. In western music, the octave is divided into twelve exactly equal intervals called semitones. The semitone represents an interval between two tones whose frequency ratio is the 12th root of 2. This ratio is further subdivided into 100 cents.
Tuning in equal temperament alters the traditional intervals of JUST INTONATION, except the octave, which remains the same. The FIFTH is lowered by 2 cents, which cannot be perceived, but the major THIRD is raised by 14 cents, to which most people are now accustomed. See INTERVAL for a comparison of intervals expressed in equal temperament and other tunings; see also Appendix C.
Interval |
Frequency ratio from starting point |
Cents from starting point |
| Unison |
1:1 |
0 |
| Semitone or minor second |
1.059463:1 |
100 |
| Whole tone or major second |
1.122462:1 |
200 |
| Minor third |
1.189207:1 |
300 |
| Major third |
1.259921:1 |
400 |
| Perfect fourth |
1.334840:1 |
500 |
| Augmented fourth/Diminished fifth |
1.414214:1 |
600 |
| Perfect fifth |
1.498307:1 |
700 |
| Minor sixth |
1.587401:1 |
800 |
| Major sixth |
1.681793:1 |
900 |
| Minor seventh |
1.781797:1 |
1,000 |
| Major seventh |
1.887749:1 |
1,100 |
| Octave |
2:1 |
1,200 |
Scale of equal temperament.
Although clearly formulated by Mersenne in 1635, equal temperament did not become generally established in practice until 1800 in Germany and later in England and France. Its historical importance is that the major and minor SCALEs being used became transposable for all twelve semitones; that is, the scale could begin on any semitone and still consist of the same frequency ratios in the scale. This system allowed musicians to modulate from one key or tonality to any other without sounding out of tune, that process not being practical in a system of just intonation.
Compare: INTONATION, JUST INTONATION, PYTHAGOREAN SCALE, TEMPERAMENT, TEMPERED TUNING. See: FLAT, QUARTER TONE, SHARP.
Sound
Example: Scale of 12-tone equal temperament.
A TUNING of a SCALE in just intonation involves the usage of FREQUENCY ratios based on integer proportions as found in the HARMONIC SERIES, instead of, for instance, a division of the OCTAVE into exactly equal parts (as in the case of EQUAL TEMPERAMENT).
The two principal scales of just intonation are the major and minor, which have frequency ratios as follows:
major scale |
1 |
9/8 |
5/4 |
4/3 |
3/2 |
5/3 |
15/8 |
2/1 |
minor scale |
1 |
9/8 |
6/5 |
4/3 |
3/2 |
8/5 |
9/5 |
2/1 |
The tuning of this system results in an absence of BEATS, but differences in the size of the INTERVALs between adjacent notes in the scale, i.e. the whole tone and semintone. The result is a limited transposability of a scale (which is not a limitation with equal temperament). The following chart shows the various intervals produced between pairs of notes in either scale, as expressed in ratios and cents.
See also: Appendix C. Compare: INTONATION, PYTHAGOREAN SCALE, TEMPERED TUNING.
Interval |
Frequency ratio from starting point |
Cents from starting point |
| Unison | 1:1 |
0 |
| Semitone | 16:15 |
111.731 |
| Minor tone | 10:9 |
182.404 |
| Major tone | 9:8 |
203.910 |
| Minor third | 6:5 |
315.641 |
| Major third | 5:4 |
386.314 |
| Perfect fourth | 4:3 |
498.045 |
| Augmented fourth | 45:32 |
590.224 |
| Diminished fifth | 64:45 |
609.777 |
| Perfect fifth | 3:2 |
701.955 |
| Minor sixth | 8:5 |
813.687 |
| Major sixth | 5:3 |
884.359 |
| Harmonic minor seventh | 7:4 |
968.826 |
| Grave minor seventh | 16:9 |
996.091 |
| Minor seventh | 9:5 |
1,017.597 |
| Major seventh | 15:8 |
1,088.269 |
| Octave | 2:1 |
1,200.000 |
Scale of Just Intonation.
Sound
Example: Scale of just intonation in A, heard melodically.
Sound Example: Scale of just intonation in A, heard as intervals.
A series of INTERVALs devised to create a SCALE dividing the OCTAVE into more or less equal steps on the basis of powers of 2/3 or 3/2, i.e. downward or upward intervals of the FIFTH respectively. Given the series:
2/3 |
1 |
3/2 |
(3/2)2 |
(3/2)3 |
(3/2)4 |
(3/2)5 |
and reducing them to intervals lying within the octave, the scale becomes:
1 |
9/8 |
81/64 |
4/3 |
3/2 |
27/16 |
243/128 |
2 |
In this scale, the ratios between successive steps are either the whole tone 9/8 (204 cents) or the diatonic semitone 256/243 (90 cents). However, the corresponding disadvantage is that no matter how many fifths (3/2 intervals) one takes, either above or below a given note, one never arrives at an octave multiple of that note.
If the power series begun above is extended to the sixth power of (3/2) on the right and the sixth power of (2/3) on the left, then a chromatic scale of 12 tones is produced. However, as with the scale of JUST INTONATION, there is a difference between a raised semitone (SHARP) and a lowered one (FLAT). Each is above and below its related note by the interval 2187/2048 (the chromatic semitone) in the Pythagorean scale, thus making C sharp distinct from D flat, for instance.
The interval between the diatonic and chromatic semitone, which is the same as that between the sixth power of (3/2) and the exact octave, is called the Pythagorean comma and has the ratio 531441/524288.
Natural HARMONICs of a pipe or string fit more closely to a scale of just intonation than to the Pythagorean.
See: Appendix C. Compare: EQUAL TEMPERAMENT, INTONATION, TEMPERED TUNING.
Sound
Example: Pythagorean scale, played melodically.
Sound Example: Pythagorean scale, played as intervals.
Some electroacoustic considerations involving vibration.
The basis of the electrical representation of sound is that a voltage which oscillates can be transformed into sound when it is amplified to drive a loudspeaker. Thus the audio signal is an oscillating voltage pattern that is analogous to an oscillating sound pressure pattern. In addition, alternating current, which historically replaced direct current as the primary source of electrical power, can inadvertently produce a sound called a hum at the same frequency as that of the oscillating voltage.
A type of electrical transmission where the charge flows directly from negative to positive poles, as in various kinds of batteries. Since there is no OSCILLATION involved in this current (it is often referred to as 0 Hz), it does not produce a HUM. However, direct current may fluctuate, for instance, as a time-dependent positive voltage, such as is used in a SOUND SYNTHESIZER as a control voltage.
Compare: ALTERNATING CURRENT. See: GENERATOR, PULSE, RECTIFICATION.
Sound
Example: A DC elevator in an old building in Vancouver. Note the absence of
electrical hum.
A sound with a short ENVELOPE, usually with a less sharp ATTACK than a CLICK. Also called an impulse.
Compare: GRAIN, IMPACT SOUND, TRANSIENT.
With frequencies below about 20 Hz, individual oscillations may be heard or sensed as slow pulses of pressure variation without PITCH characteristics.
See: AMPLITUDE MODULATION, BEATS, INFRASONIC, rustle noise, SONAR.
Sound
Example: Pulsating ventilation duct, Burrard Dry Docks, Vancouver, B.C.
In electronics, the pulse is a rectangular DIRECT CURRENT voltage SIGNAL produced by a pulse GENERATOR. Its form could be described as an on-off voltage, where the 'on' voltage has a duration of t1 and is repeated after an interval of t2, during which the voltage drops to the 'off' level. Pulses can be used to control a SWITCH. Compare: RECTIFICATION.

A pulse wave is an ALTERNATING CURRENT signal, whose WAVEFORM contains both positive and negative sections. The ratio of the 'on' to 'off' times of the waveform is called the duty cycle. The pulse wave may be distinguished from the SQUARE WAVE in that the latter has a duty cycle of 1:1. Compare: SAWTOOTH WAVE, TRIANGLE WAVE.
Sound
Example: Pulse wave with a 1:4 duty cycle.
Any type of electrical transmission where the current repeatedly changes direction, and the voltage varies between maxima and minima. Therefore, any electrical AUDIO signal may be called an AC signal. Whereas the voltage range of an audio signal is less than a few volts, that of electrical current is standardized in the 110-120 volt or 220 volt range with a frequency of 60 or 50 Hz (see map).
When electrical equipment is improperly grounded, a HUM is heard at one of those PITCHes, or a multiple thereof. Alternating current was introduced in the 1890's, and is now used almost universally to distribute electricity on a large scale.
Compare: DIRECT CURRENT, OSCILLATION. See: GENERATOR, PULSE WAVE, RECTIFICATION.
The World Soundscape Project's Hum Map of the world showing countries using 60 Hz or 50 Hz alternating current.
Sound
Example: Electrical hum in a North American restaurant.
Sound Example: A DC elevator in an old building in Vancouver. Note the absence of electrical hum.
A constant TONE, usually with a frequency of 50 or 60 Hz, or some HARMONIC thereof, which is heard from electrical equipment that is improperly grounded, or as a result of mechanical vibration in any electrical device.
The sound is an example of a pitched DRONE, and is similar (except in duration) to the human vocal activity of the same name. In countries using ALTERNATING CURRENT, hums form a common KEYNOTE SOUND. As the frequency of alternating current varies from country to country, the pitch of this hum varies as shown on the world hum map (see ALTERNATING CURRENT).
Compare: INTERNAL DYNAMICS, narrow band noise, REDUNDANCY, RUMBLE, STATIONARY SOUND, TEMPO.
Sound
Example: Power line hum, Manitoba.
Sound Example: Electrical hum in a restaurant.
Sound Example: Hum of fluorescent lights.
Continuously or repetitively sounding TONEs or NOISEs which seem to have little or no variation in time.
See: HUM, LO-FI, REDUNDANCY, STATIONARY SOUND, TAPE LOOP. Compare: GLISSANDO, GRAIN, TEMPO.
In music, the drone functions to stabilize the tonic, and as such serves a harmonic function. See: HARMONY, KEYNOTE SOUND.
In an environment, drones serve no function, and are almost always the acoustic by-product of some electrical, mechanical or aerodynamic process. Usually, such sounds are monotonous and boring, but when they contain sufficient INTERNAL DYNAMICS and HARMONICs, or when they are environmentally altered or enhanced (for example, by PHASING, DOPPLER SHIFT, REVERBERATION or wind gradients), they can become interesting to the ear, and evoke positive images and feelings. Also called steady state sound.

ENVELOPEs of two recorded sounds showing relatively constant or repetitive intensity levels that are characteristic of drones.
Sound
Example: Diesel engine.
Sound Example: Oil well pump.
Sound Example: Electrical hum from a power line.
The process of CLIPPING a SIGNAL or WAVEFORM such that either the positive or negative portion of it is completely eliminated. This technique can be used to convert ALTERNATING CURRENT into DIRECT CURRENT, for instance to produce control voltages for use in a SOUND SYNTHESIZER.
Types of rectification are shown below:
Compare: COMPRESSION, GENERATOR, PEAK CLIPPING, PULSE, SWITCH, TRANSDUCER.

Sound
Example: Sine wave at 100 Hz.
Sound Example: Sine wave with half-wave rectification.
Sound Example: Sine wave with full-wave rectification (which appears one octave higher).
Physical systems that vibrate will do so at one or more frequencies. In this chapter you will learn about simple harmonic motion, vibrating systems, complex vibrating systems, and you will be introduced to vibration in musical instruments.
This chapter describes vibrating systems with one mass, two masses, and up to infinite masses. Understanding how the different modes of a system with a finite number of masses works will help you understand how an infinite mass system such as a guitar string works.
The world is full of waves. All the space is crisscrossed by waves of different type and many different frequencies. Basically we can distinguish electromagnetic waves (as light, tadio, X.rays, etc) and mechanical waves (sound, sea waves, etc.). All waves possess certain common properties and some particular properties.
We are most interested in sound waves. Although sound waves are vastly different from electromagnetic waves or ocean waves, we will find that concepts developed for other types of waves will be quite useful for our study.
A wave can transport energy from one point to another without transporting matter and that's why practically all communication depends on waves of some type.
Physical systems will resonate when excited by a force applied at a specific frequency. Consider a simple mechanical system: a child in a swing. The swing has a natural frequency that is determined by its length. If the swing is given a small push at the right time in each cycle, its amplitude gradually increases. This is an example of resonance.
This chapter introduces you to how standing waves are set up in pipes such as organs pipes, flutes, and trumpets.
When SOUND WAVEs from two different sources at the same FREQUENCY strike one another, pressure displacements occur which are the sum and the difference of the AMPLITUDEs of the two waves.
Where the crests of one set of waves coincide with the crests of another set, the amplitude is increased. This is called constructive interference (the lines indicated by C on the diagram). Where the crests of one set fall on the troughs of the other, i.e. they are 180° out of PHASE, the two will cancel one another and the resulting amplitude is decreased. This is called destructive interference or CANCELLATION (the lines indicated by D on the diagram).
See: COMPRESSION, RAREFACTION.
BEATS and PHASING are examples of interference effects. Another important type of interference results in STANDING WAVES and dead spots, and occurs when two waves of the same frequency and amplitude travel in opposite directions. Interference also causes ground effect in outdoor situations (see SOUND PROPAGATION).
See: DIFFUSION, LAW OF SUPERPOSITION, PHASE-SHIFT. Compare: DIFFRACTION, SOUND SHADOW.

Interference pattern between the wave fronts of two sound sources. Constructive interference is indicated by lines C, and destructive interference by lines D.
Sound Pressure
Particle Velocity
Sound Power
Frequency
The Speed of Sound
Wavelength
SPEED OF SOUND
The speed of a SOUND WAVE varies greatly when propagated in different media, the PROPAGATION velocity depending on the elasticity (or compressibility), temperature and density of the medium in question.
See also: ACOUSTIC IMPEDANCE, PARTICLE VELOCITY, REFRACTION, SOUND PROPAGATION.
In air, for instance, temperature and atmospheric pressure are significant factors. At 0° Centigrade and 1.013 x 10⁵ Newtons per square meter (normal atmospheric pressure), the speed of sound is 331.5 meters/sec, i.e. 1087 ft/sec or 740 miles/hour. At 20°C (68°F) the speed is 1130 ft/sec or 344 m/sec. Propagation speeds for other media are given in the chart below. For each degree Centigrade increase in temperature, the speed of sound increases by 0.61 m/sec or 2.0 ft/sec.
See: DOPPLER EFFECT, ECHOLOCATION, SONAR, SONIC BOOM, SUBSONIC, SUPERSONIC, SUPERSONIC TRANSPORT, WAVELENGTH.
Speed of Sound in Various Substances
Substance |
Temperature (°C) |
Speed (m/sec) |
Speed (ft/sec) |
CO2 |
0 |
258 |
816 |
CO2 |
35 |
274 |
900 |
Air |
0 |
331.5 |
1,087 |
Air |
20 |
344 |
1,130 |
Water Vapor |
35 |
402 |
1,320 |
Helium |
20 |
927 |
3,040 |
Hydrogen |
0 |
1,270 |
4,165 |
Water |
15 |
1,437 |
4,714 |
Steel |
- |
5,000 |
16,400 |
BEATS
Acoustics / Psychoacoustics |
If two TONEs are about 15 Hertz or less apart, INTERFERENCE will result from their similar though not exactly identical frequencies. Gradually they will move out of PHASE until at 180° destructive interference results, producing diminished loudness. When they move back into phase, constructive interference will produce increased loudness. Thus, beats are a form of AMPLITUDE MODULATION. As two frequencies are brought closer together, the beats will gradually slow down and disappear when they become identical.
See: CANCELLATION, HETERODYNE, JUST INTONATION, LAW OF SUPERPOSITION, PHASE-SHIFT. Compare: PHASING, PULSE.
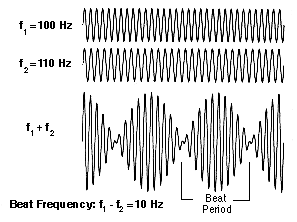
The superposition of two sine waves producing beats.
Sound
Example: Beats produced by 100 and 110 Hz, with the higher tone
gradually reduced to 100 Hz causing the beats to slow down and disappear.
Beats recur at a rate equal to the difference between the two frequencies, called the beat frequency. Thus the beat frequency produced by 500 Hz and 496 Hz is 4 Hz. Piano tuners use the phenomenon of beats when bringing strings into UNISON.
See: TUNING. Compare: GRAIN, TREMOLO, VIBRATO.
Beats arising from the mistuned unison are called first-order beats, and are both an acoustic and psychoacoustic phenomenon. Beats also may be heard between pure tones that are nearly an OCTAVE, FIFTH or FOURTH apart. These are called secondary or second-order beats, where the beat frequency is equal to the frequency difference e between the upper tone and the exact interval for the octave, 2e for the fifth and 3e for the fourth. However, no amplitude modulation is present, and the beating results from effects of neural processing.
Although two tones with a constant PHASE DIFFERENCE sound the same, independent of the degree of phase difference, in the case of secondary beats, the phase difference is constantly changing, producing a changing WAVEFORM, as can be seen in the diagram below. The phenomenon occurs only where the lower tone is below about 1500 Hz. However, it also occurs with DICHOTIC listening where it is called binaural beats and where the phase difference is interpreted as in BINAURAL HEARING, i.e. as a spatial difference. See also: CRITICAL BANDWIDTH.

Wave pattern showing second-order beats created by a mistuned octave. Note the shifting phase pattern with no change in total amplitude.
Sound
Example: Second-order beats between 100 and 201 Hz.
 Sound
Example: Second order beats presented dichotically between 200 and
401 Hz (to be listened to via headphones).
Sound
Example: Second order beats presented dichotically between 200 and
401 Hz (to be listened to via headphones).

